| Red | Green | Blue | |
| z | 17.64 | ||
| znorm | Inf | ||
| sky | -Inf | -Inf | -Inf |
| S/N | 28.4 | 46.3 | 49.2 |
| S/N(c) | 0.0 | 0.0 | 0.0 |
| SN(E/C) |
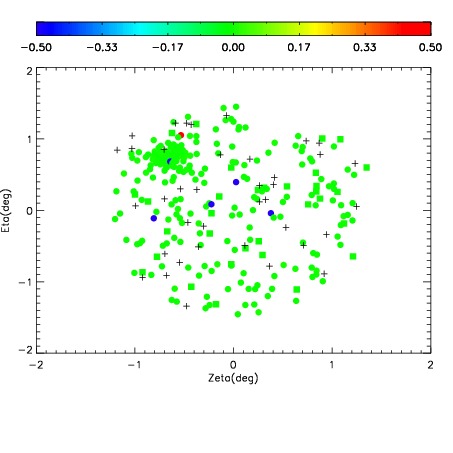
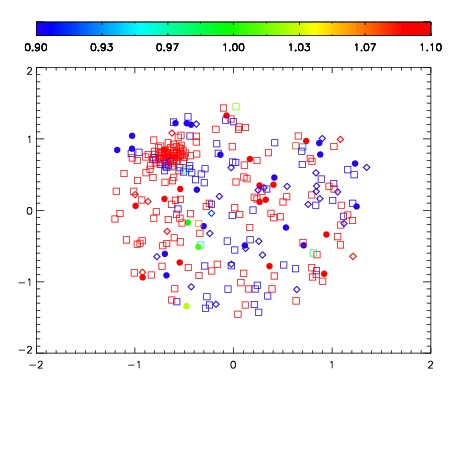
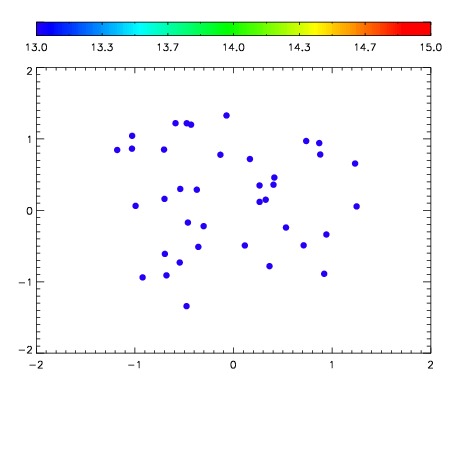

| Frame | Nreads | Zeropoints | Mag plots | Spatial mag deviation | Spatial sky 16325A emission deviations (filled: sky, open: star) | Spatial sky continuum emission | Spatial sky telluric CO2 absorption deviations (filled: H < 10) | |||||||||||||||||||||||
| 0 | 0 |
|
|
|
|
|
|
| IPAIR | NAME | SHIFT | NEWSHIFT | S/N | NAME | SHIFT | NEWSHIFT | S/N |
| 0 | 05160012 | 0.495714 | 0.00000 | 198.131 | 05160013 | 0.000633063 | 0.495081 | 197.246 |
| 1 | 05160015 | 0.493669 | 0.00204501 | 198.061 | 05160014 | -0.000797407 | 0.496511 | 193.764 |
| 2 | 05160011 | 0.494889 | 0.000825018 | 196.400 | 05160010 | 0.00000 | 0.495714 | 193.270 |
| 3 | 05160016 | 0.495678 | 3.60012e-05 | 193.605 | 05160017 | 0.00153496 | 0.494179 | 185.381 |