| Red | Green | Blue | |
| z | 17.64 | ||
| znorm | Inf | ||
| sky | -Inf | -Inf | -Inf |
| S/N | 32.5 | 58.3 | 70.5 |
| S/N(c) | 0.0 | 0.0 | 0.0 |
| SN(E/C) |
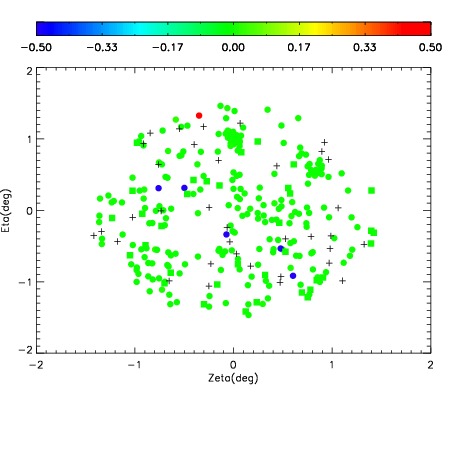
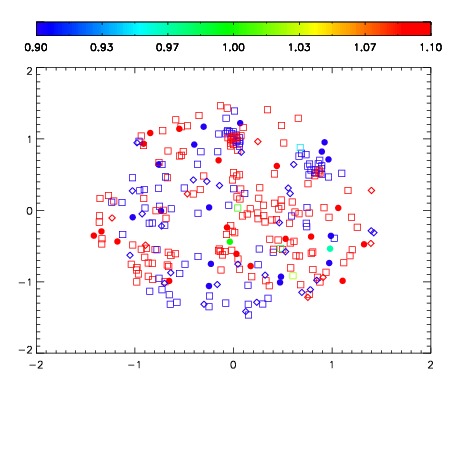
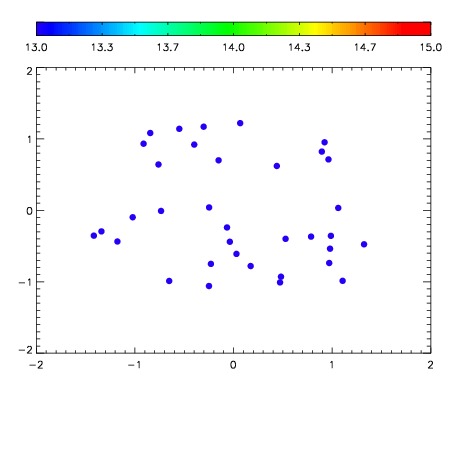

| Frame | Nreads | Zeropoints | Mag plots | Spatial mag deviation | Spatial sky 16325A emission deviations (filled: sky, open: star) | Spatial sky continuum emission | Spatial sky telluric CO2 absorption deviations (filled: H < 10) | |||||||||||||||||||||||
| 0 | 0 |
|
|
|
|
|
|
| IPAIR | NAME | SHIFT | NEWSHIFT | S/N | NAME | SHIFT | NEWSHIFT | S/N |
| 0 | 03700095 | 0.508079 | 0.00000 | 169.830 | 03700093 | 0.00000 | 0.508079 | 155.271 |
| 1 | 03700106 | 0.496770 | 0.0113090 | 186.194 | 03700104 | -2.77256e-05 | 0.508107 | 184.189 |
| 2 | 03700107 | 0.498630 | 0.00944901 | 185.743 | 03700108 | 0.00103920 | 0.507040 | 184.087 |
| 3 | 03700103 | 0.499436 | 0.00864300 | 184.408 | 03700097 | 0.00103012 | 0.507049 | 181.380 |
| 4 | 03700102 | 0.499498 | 0.00858098 | 180.828 | 03700105 | 0.00135088 | 0.506728 | 180.939 |
| 5 | 03700098 | 0.498476 | 0.00960299 | 178.534 | 03700096 | 0.000145272 | 0.507934 | 179.656 |
| 6 | 03700099 | 0.504337 | 0.00374198 | 174.868 | 03700100 | 0.000394326 | 0.507685 | 175.295 |
| 7 | 03700094 | 0.503943 | 0.00413597 | 171.136 | 03700101 | -0.000227866 | 0.508307 | 174.485 |