| Red | Green | Blue | |
| z | 17.64 | ||
| znorm | Inf | ||
| sky | -Inf | -Inf | -Inf |
| S/N | 30.3 | 50.9 | 59.3 |
| S/N(c) | 0.0 | 0.0 | 0.0 |
| SN(E/C) |
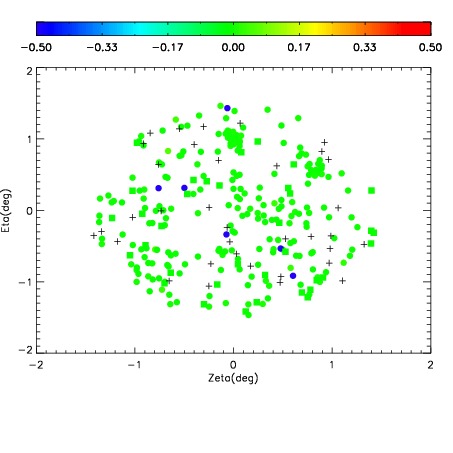
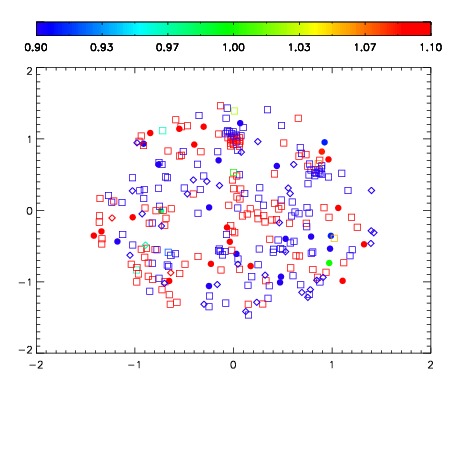
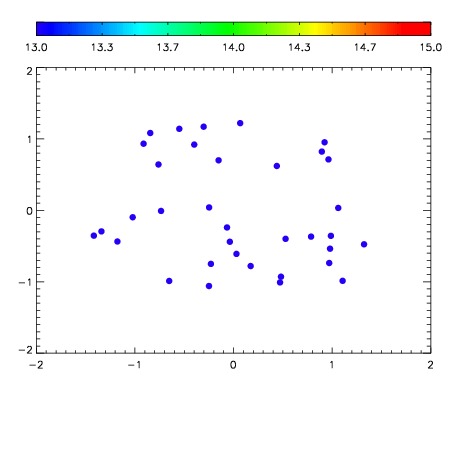

| Frame | Nreads | Zeropoints | Mag plots | Spatial mag deviation | Spatial sky 16325A emission deviations (filled: sky, open: star) | Spatial sky continuum emission | Spatial sky telluric CO2 absorption deviations (filled: H < 10) | |||||||||||||||||||||||
| 0 | 0 |
|
|
|
|
|
|
| IPAIR | NAME | SHIFT | NEWSHIFT | S/N | NAME | SHIFT | NEWSHIFT | S/N |
| 0 | 04030090 | 0.500246 | 0.00000 | 183.116 | 04030091 | 0.000814472 | 0.499432 | 180.866 |
| 1 | 04030089 | 0.499647 | 0.000598997 | 187.184 | 04030088 | 0.00000 | 0.500246 | 186.035 |
| 2 | 04030097 | 0.498538 | 0.00170800 | 173.751 | 04030092 | 0.000569076 | 0.499677 | 176.718 |
| 3 | 04030094 | 0.498605 | 0.00164098 | 173.068 | 04030095 | 0.00378427 | 0.496462 | 172.913 |
| 4 | 04030093 | 0.498067 | 0.00217900 | 170.807 | 04030096 | 0.00207356 | 0.498172 | 172.611 |