| Red | Green | Blue | |
| z | 17.64 | ||
| znorm | Inf | ||
| sky | -NaN | -Inf | -Inf |
| S/N | 22.5 | 41.3 | 49.7 |
| S/N(c) | 0.0 | 0.0 | 0.0 |
| SN(E/C) |
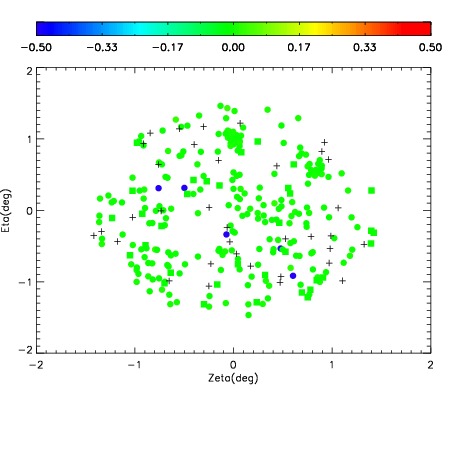
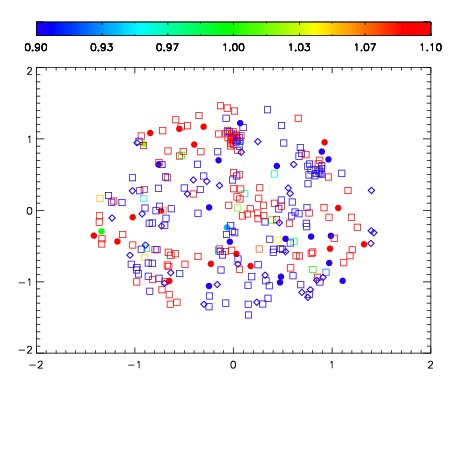
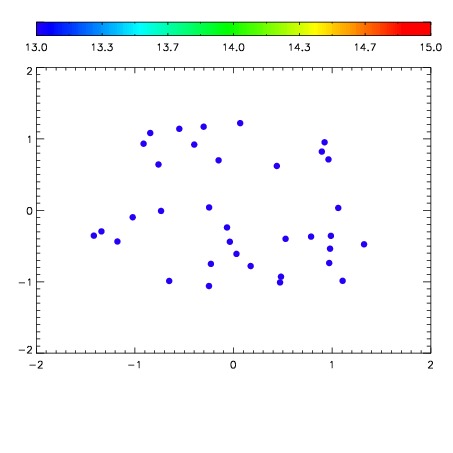

| Frame | Nreads | Zeropoints | Mag plots | Spatial mag deviation | Spatial sky 16325A emission deviations (filled: sky, open: star) | Spatial sky continuum emission | Spatial sky telluric CO2 absorption deviations (filled: H < 10) | |||||||||||||||||||||||
| 0 | 0 |
|
|
|
|
|
|
| IPAIR | NAME | SHIFT | NEWSHIFT | S/N | NAME | SHIFT | NEWSHIFT | S/N |
| 0 | 04280080 | 0.499839 | 0.00000 | 180.684 | 04280074 | 0.00000 | 0.499839 | 171.407 |
| 1 | 04280079 | 0.492229 | 0.00760999 | 176.186 | 04280081 | 0.00154829 | 0.498291 | 171.331 |
| 2 | 04280075 | 0.492947 | 0.00689200 | 164.119 | 04280077 | 0.00117456 | 0.498664 | 163.449 |
| 3 | 04280076 | 0.496552 | 0.00328702 | 154.795 | 04280078 | 0.000508961 | 0.499330 | 160.524 |