| Red | Green | Blue | |
| z | 17.64 | ||
| znorm | Inf | ||
| sky | -NaN | -Inf | -Inf |
| S/N | 27.6 | 46.1 | 53.5 |
| S/N(c) | 0.0 | 0.0 | 0.0 |
| SN(E/C) |
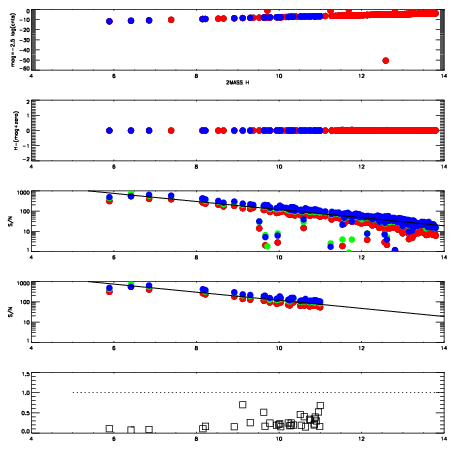

| Frame | Nreads | Zeropoints | Mag plots | Spatial mag deviation | Spatial sky 16325A emission deviations (filled: sky, open: star) | Spatial sky continuum emission | Spatial sky telluric CO2 absorption deviations (filled: H < 10) | |||||||||||||||||||||||
| 0 | 0 |
|
|
|
|
|
|
| IPAIR | NAME | SHIFT | NEWSHIFT | S/N | NAME | SHIFT | NEWSHIFT | S/N |
| 0 | 04290069 | 0.504086 | 0.00000 | 193.803 | 04290074 | 0.000724862 | 0.503361 | 193.082 |
| 1 | 04290068 | 0.500291 | 0.00379503 | 195.123 | 04290070 | 0.00140823 | 0.502678 | 196.586 |
| 2 | 04290072 | 0.499661 | 0.00442502 | 194.099 | 04290071 | 0.000134893 | 0.503951 | 196.230 |
| 3 | 04290073 | 0.501161 | 0.00292504 | 193.103 | 04290067 | 0.00000 | 0.504086 | 190.181 |