| Red | Green | Blue | |
| z | 17.64 | ||
| znorm | Inf | ||
| sky | -Inf | -NaN | -Inf |
| S/N | 22.8 | 39.7 | 47.9 |
| S/N(c) | 0.0 | 0.0 | 0.0 |
| SN(E/C) |
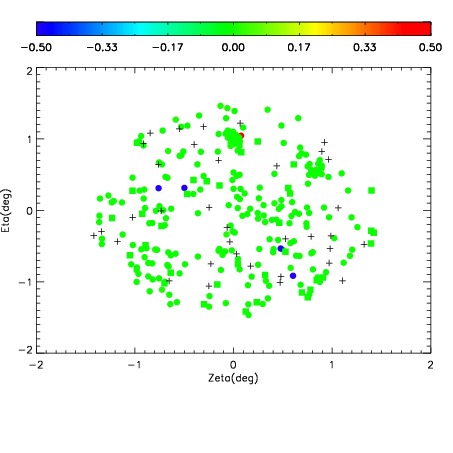
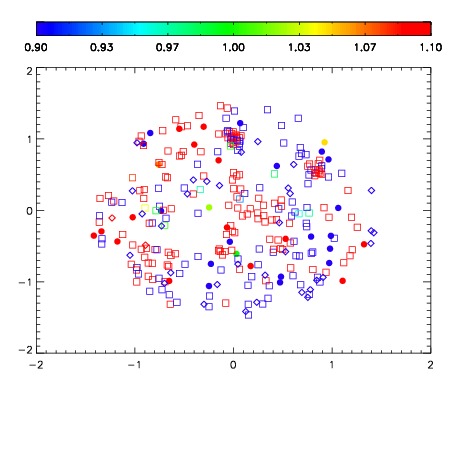
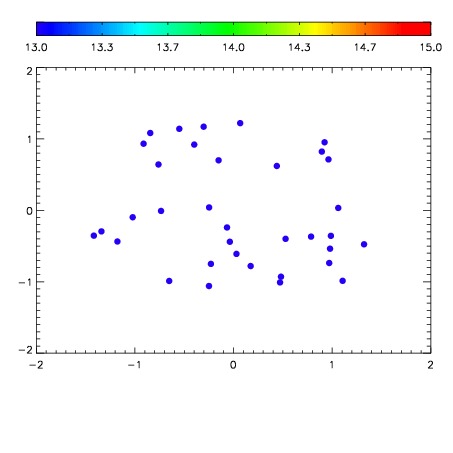

| Frame | Nreads | Zeropoints | Mag plots | Spatial mag deviation | Spatial sky 16325A emission deviations (filled: sky, open: star) | Spatial sky continuum emission | Spatial sky telluric CO2 absorption deviations (filled: H < 10) | |||||||||||||||||||||||
| 0 | 0 |
|
|
|
|
|
|
| IPAIR | NAME | SHIFT | NEWSHIFT | S/N | NAME | SHIFT | NEWSHIFT | S/N |
| 0 | 04360038 | 0.492345 | 0.00000 | 171.423 | 04360040 | -0.00173243 | 0.494077 | 184.011 |
| 1 | 04360042 | 0.490424 | 0.00192100 | 181.393 | 04360043 | -0.00230893 | 0.494654 | 189.613 |
| 2 | 04360037 | 0.491885 | 0.000459999 | 172.408 | 04360036 | 0.00000 | 0.492345 | 184.089 |
| 3 | 04360041 | 0.490265 | 0.00207999 | 169.330 | 04360039 | -0.00132596 | 0.493671 | 179.925 |