| Red | Green | Blue | |
| z | 17.64 | ||
| znorm | Inf | ||
| sky | -NaN | -Inf | -Inf |
| S/N | 30.8 | 51.5 | 61.7 |
| S/N(c) | 0.0 | 0.0 | 0.0 |
| SN(E/C) |
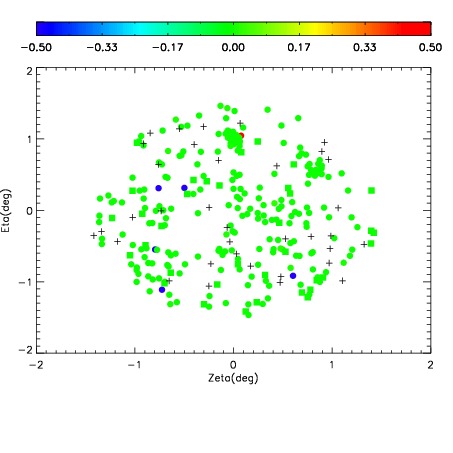
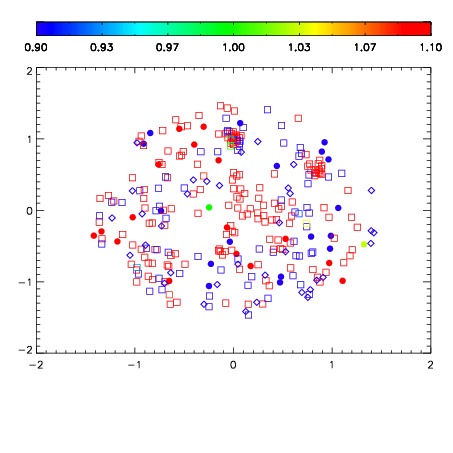
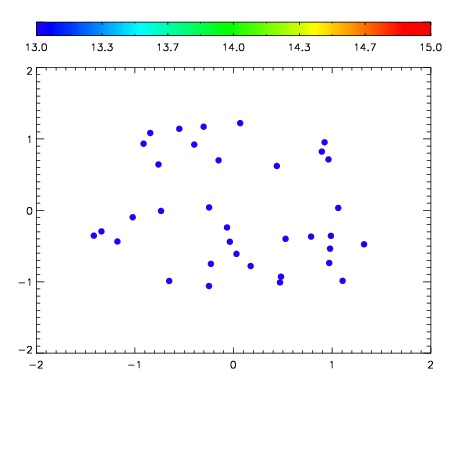

| Frame | Nreads | Zeropoints | Mag plots | Spatial mag deviation | Spatial sky 16325A emission deviations (filled: sky, open: star) | Spatial sky continuum emission | Spatial sky telluric CO2 absorption deviations (filled: H < 10) | |||||||||||||||||||||||
| 0 | 0 |
|
|
|
|
|
|
| IPAIR | NAME | SHIFT | NEWSHIFT | S/N | NAME | SHIFT | NEWSHIFT | S/N |
| 0 | 04370042 | 0.495937 | 0.00000 | 202.511 | 04370036 | 0.00000 | 0.495937 | 204.103 |
| 1 | 04370041 | 0.492737 | 0.00319999 | 204.855 | 04370040 | -0.00215666 | 0.498094 | 206.032 |
| 2 | 04370037 | 0.493592 | 0.00234500 | 203.282 | 04370039 | 0.000187066 | 0.495750 | 204.888 |
| 3 | 04370038 | 0.494670 | 0.00126699 | 198.847 | 04370043 | -0.00206866 | 0.498006 | 200.984 |