| Red | Green | Blue | |
| z | 17.64 | ||
| znorm | Inf | ||
| sky | -Inf | -Inf | -Inf |
| S/N | 28.7 | 51.1 | 52.3 |
| S/N(c) | 0.0 | 0.0 | 0.0 |
| SN(E/C) |
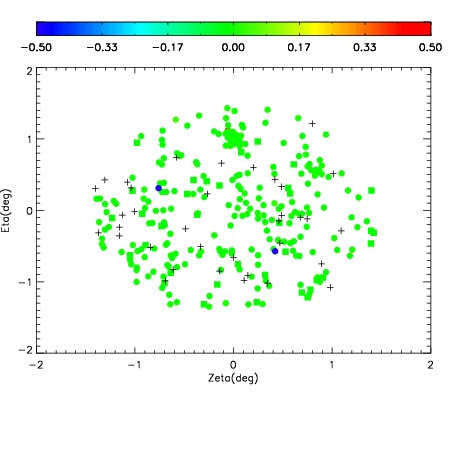
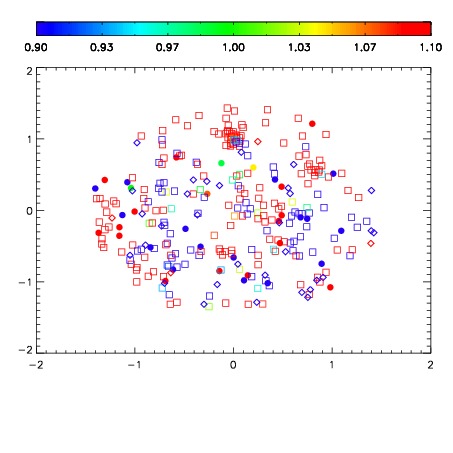


| Frame | Nreads | Zeropoints | Mag plots | Spatial mag deviation | Spatial sky 16325A emission deviations (filled: sky, open: star) | Spatial sky continuum emission | Spatial sky telluric CO2 absorption deviations (filled: H < 10) | |||||||||||||||||||||||
| 0 | 0 |
|
|
|
|
|
|
| IPAIR | NAME | SHIFT | NEWSHIFT | S/N | NAME | SHIFT | NEWSHIFT | S/N |
| 0 | 04300016 | 0.497225 | 0.00000 | 174.859 | 04300010 | 0.00000 | 0.497225 | 158.935 |
| 1 | 04300012 | 0.497130 | 9.49800e-05 | 182.856 | 04300014 | 0.00167163 | 0.495553 | 184.875 |
| 2 | 04300015 | 0.495783 | 0.00144199 | 177.016 | 04300017 | 0.00411423 | 0.493111 | 183.985 |
| 3 | 04300011 | 0.496143 | 0.00108197 | 176.938 | 04300013 | 0.00153611 | 0.495689 | 183.923 |