| Red | Green | Blue | |
| z | 17.64 | ||
| znorm | Inf | ||
| sky | -Inf | -Inf | -Inf |
| S/N | 19.4 | 37.7 | 40.0 |
| S/N(c) | 0.0 | 0.0 | 0.0 |
| SN(E/C) |
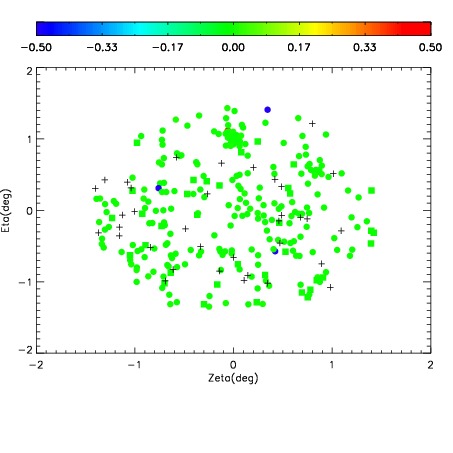


| Frame | Nreads | Zeropoints | Mag plots | Spatial mag deviation | Spatial sky 16325A emission deviations (filled: sky, open: star) | Spatial sky continuum emission | Spatial sky telluric CO2 absorption deviations (filled: H < 10) | |||||||||||||||||||||||
| 0 | 0 |
|
|
|
|
|
|
| IPAIR | NAME | SHIFT | NEWSHIFT | S/N | NAME | SHIFT | NEWSHIFT | S/N |
| 0 | 04570042 | 0.502610 | 0.00000 | 148.348 | 04570039 | 0.00129854 | 0.501311 | 151.028 |
| 1 | 04570041 | 0.500336 | 0.00227404 | 165.855 | 04570040 | 0.00124948 | 0.501361 | 166.902 |
| 2 | 04570037 | 0.500392 | 0.00221801 | 129.732 | 04570043 | 0.00560738 | 0.497003 | 139.056 |
| 3 | 04570038 | 0.501086 | 0.00152403 | 114.412 | 04570036 | 0.00000 | 0.502610 | 127.722 |