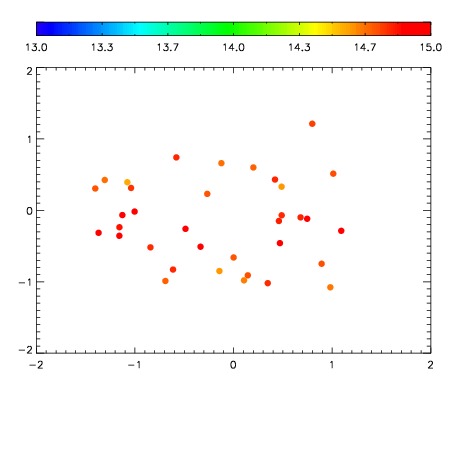
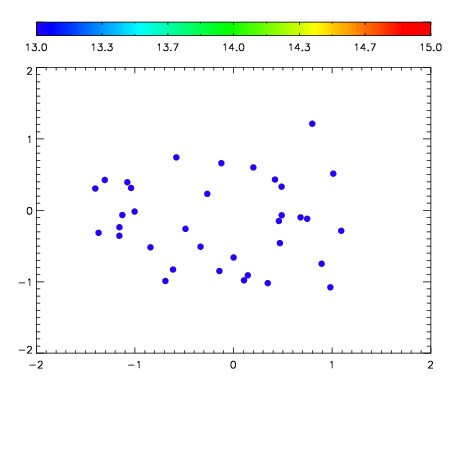
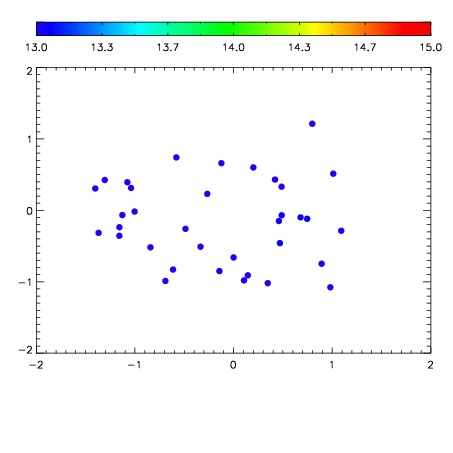
| Frame | Nreads | Zeropoints | Mag plots
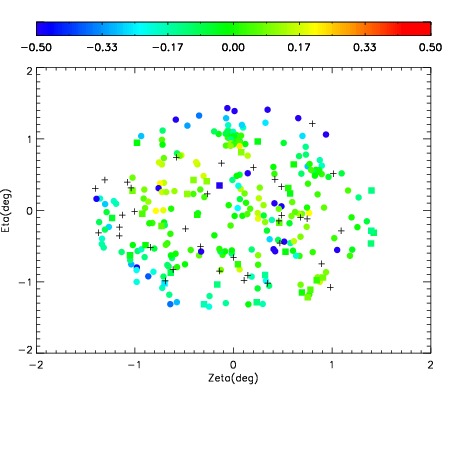
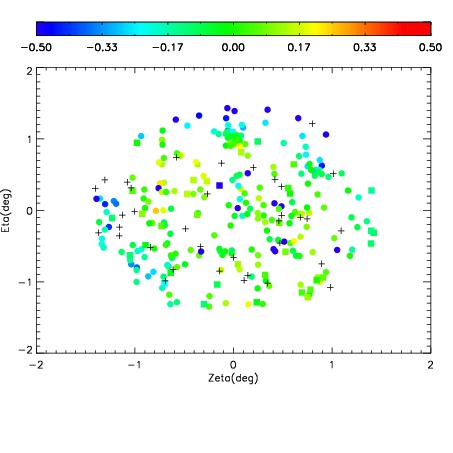
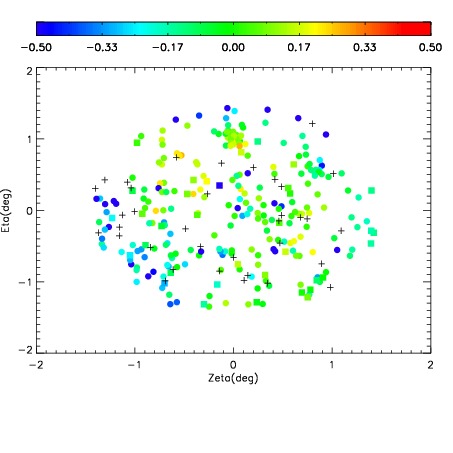
| Spatial mag deviation
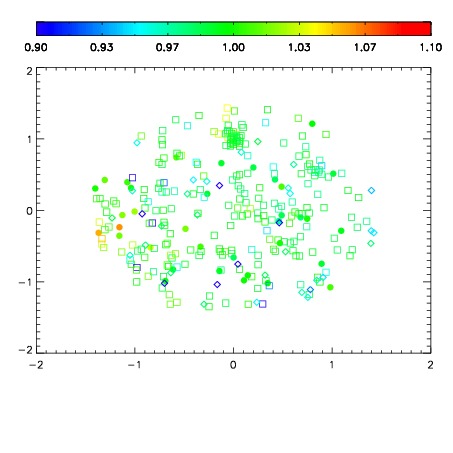
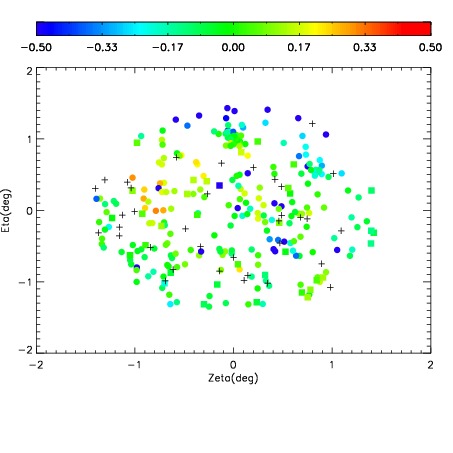
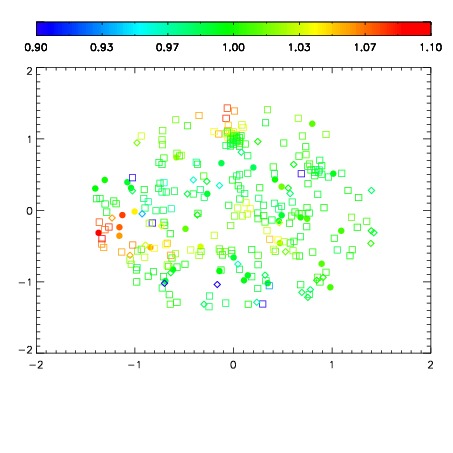
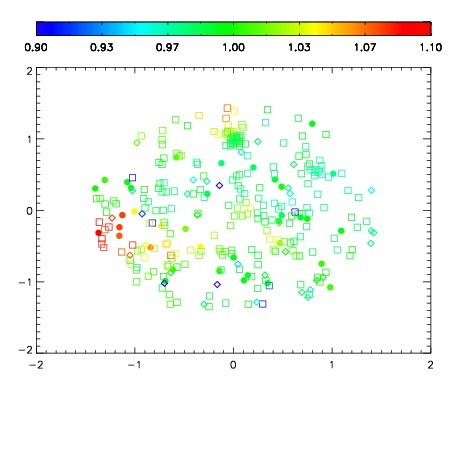
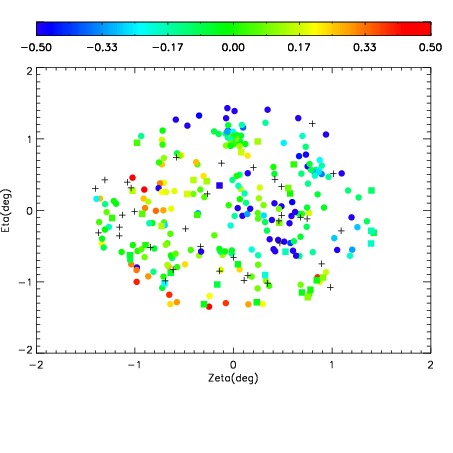
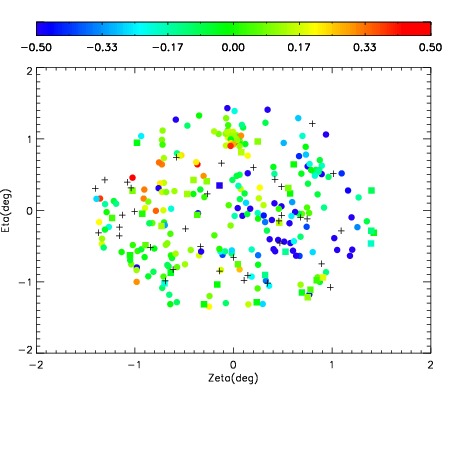
| Spatial sky 16325A emission deviations (filled: sky, open: star)
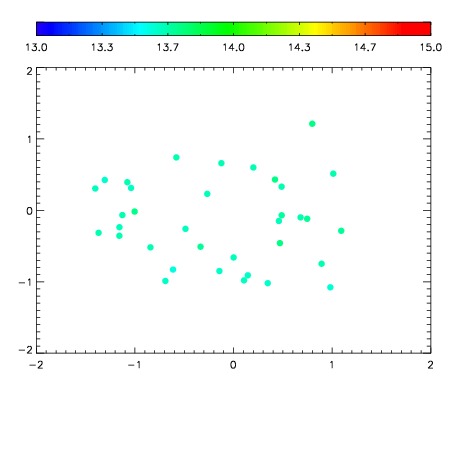
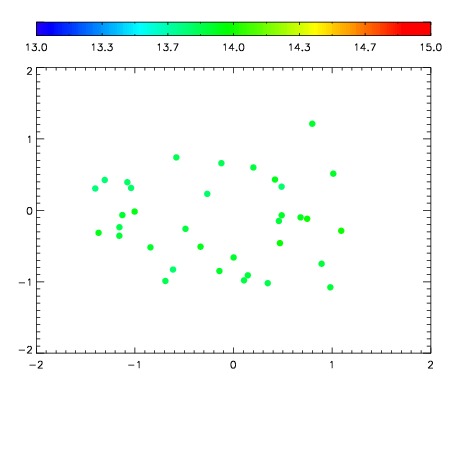
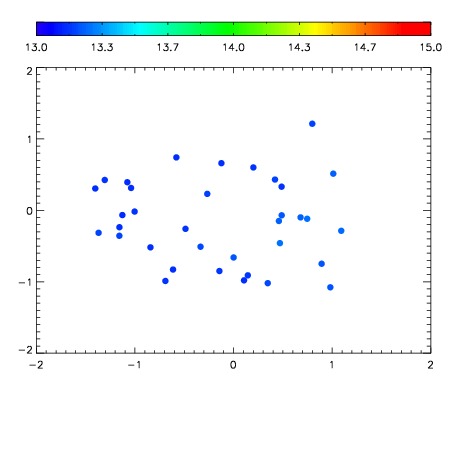
| Spatial sky continuum emission
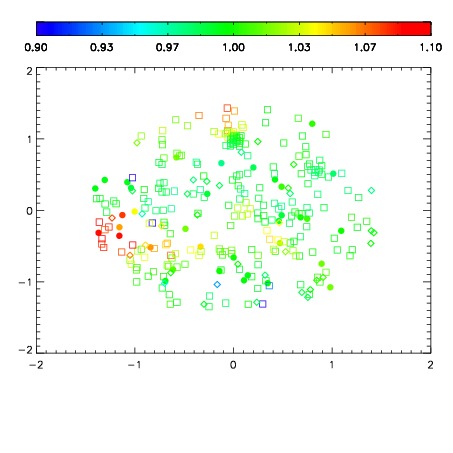
| Spatial sky telluric CO2 absorption deviations (filled: H < 10)
|
| 4590019
| 47
| | Red | Green | Blue
| | z | | 18.92
| | znorm | | 14.74
| | sky | 14.9 | 14.9 | 14.5
| | S/N | 14.0 | 23.8 | 23.7
| | S/N(c) | 12.3 | 22.4 | 22.8
| | SN(E/C) 0.34
|
| 
| 
| 
| 
| 
|
| 4590020
| 47
| | Red | Green | Blue
| | z | | 18.94
| | znorm | | 14.76
| | sky | 14.8 | 14.8 | 14.7
| | S/N | 13.9 | 23.0 | 23.6
| | S/N(c) | 12.3 | 21.5 | 22.4
| | SN(E/C) 0.33
|
| 
| 
| 
| 
| 
|
| 4590021
| 47
| | Red | Green | Blue
| | z | | 17.69
| | znorm | | 13.51
| | sky | 13.0 | 12.9 | 12.9
| | S/N | 4.6 | 8.2 | 8.8
| | S/N(c) | 4.3 | 7.7 | 8.6
| | SN(E/C) 0.57
|
| 
| 
| 
| 
| 
|
| 4590022
| 47
| | Red | Green | Blue
| | z | | 17.52
| | znorm | | 13.34
| | sky | 13.1 | 13.0 | 13.0
| | S/N | 4.0 | 7.6 | 8.1
| | S/N(c) | 3.7 | 6.9 | 7.9
| | SN(E/C) 0.63
|
| 
| 
| 
| 
| 
|
| 4590023
| 47
| | Red | Green | Blue
| | z | | 17.93
| | znorm | | 13.75
| | sky | 13.8 | 13.7 | 13.7
| | S/N | 6.2 | 10.9 | 11.8
| | S/N(c) | 5.7 | 9.8 | 11.4
| | SN(E/C) 0.52
|
| 
| 
| 
| 
| 
|
| 4590024
| 47
| | Red | Green | Blue
| | z | | 17.80
| | znorm | | 13.62
| | sky | 14.0 | 13.9 | 13.9
| | S/N | 5.3 | 10.0 | 10.9
| | S/N(c) | 4.7 | 8.8 | 10.3
| | SN(E/C) 0.56
|
| 
| 
| 
| 
| 
|
| 4590025
| 47
| | Red | Green | Blue
| | z | | 16.90
| | znorm | | 12.72
| | sky | 13.1 | 13.0 | 13.0
| | S/N | 2.1 | 4.3 | 4.5
| | S/N(c) | 2.1 | 4.1 | 4.9
| | SN(E/C) 0.74
|
| 
| 
| 
| 
| 
|
| 4590026
| 47
| | Red | Green | Blue
| | z | | 16.43
| | znorm | | 12.25
| | sky | 13.2 | 13.2 | 13.2
| | S/N | 1.5 | 3.1 | 3.3
| | S/N(c) | 1.4 | 2.7 | 3.3
| | SN(E/C) 0.85
|
| 
| 
| 
| 
| 
|