| Red | Green | Blue | |
| z | 17.64 | ||
| znorm | Inf | ||
| sky | -Inf | -Inf | -Inf |
| S/N | 23.7 | 38.7 | 44.1 |
| S/N(c) | 0.0 | 0.0 | 0.0 |
| SN(E/C) |

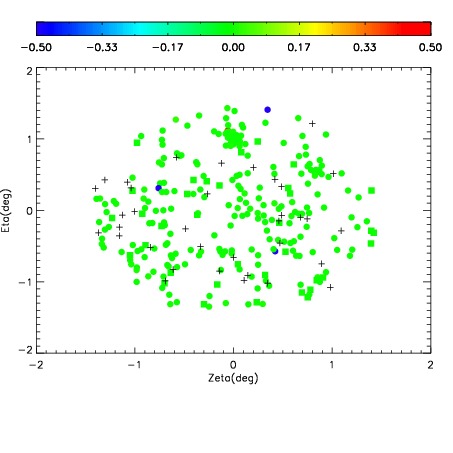

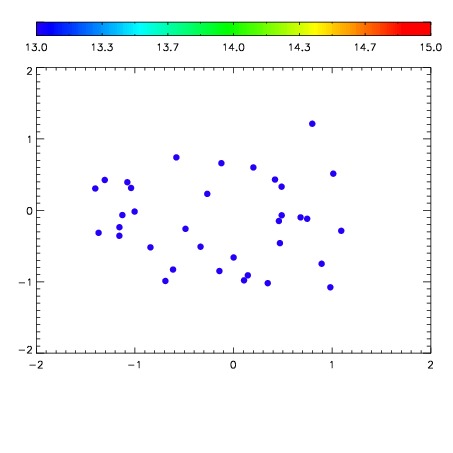

| Frame | Nreads | Zeropoints | Mag plots | Spatial mag deviation | Spatial sky 16325A emission deviations (filled: sky, open: star) | Spatial sky continuum emission | Spatial sky telluric CO2 absorption deviations (filled: H < 10) | |||||||||||||||||||||||
| 0 | 0 |
|
|
|
|
|
|
| IPAIR | NAME | SHIFT | NEWSHIFT | S/N | NAME | SHIFT | NEWSHIFT | S/N |
| 0 | 04600053 | 0.495430 | 0.00000 | 164.341 | 04600050 | 0.00120796 | 0.494222 | 170.531 |
| 1 | 04600048 | 0.494017 | 0.00141299 | 160.804 | 04600051 | -0.000177267 | 0.495607 | 169.911 |
| 2 | 04600049 | 0.495039 | 0.000391006 | 159.670 | 04600047 | 0.00000 | 0.495430 | 169.647 |
| 3 | 04600052 | 0.494520 | 0.000909984 | 146.023 | 04600054 | 0.00182682 | 0.493603 | 159.224 |