| Red | Green | Blue | |
| z | 17.64 | ||
| znorm | Inf | ||
| sky | -Inf | -NaN | -Inf |
| S/N | 33.1 | 57.7 | 63.7 |
| S/N(c) | 0.0 | 0.0 | 0.0 |
| SN(E/C) |

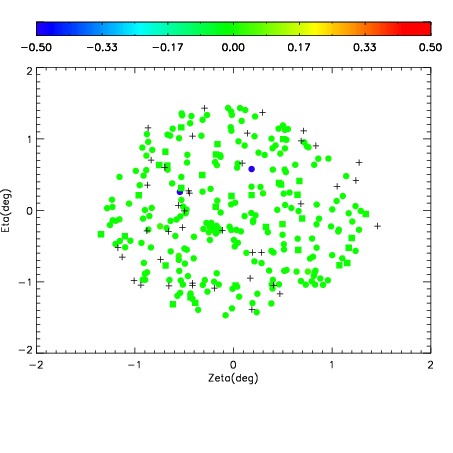
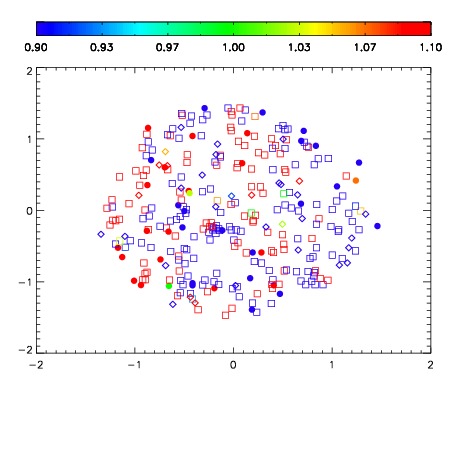

| Frame | Nreads | Zeropoints | Mag plots | Spatial mag deviation | Spatial sky 16325A emission deviations (filled: sky, open: star) | Spatial sky continuum emission | Spatial sky telluric CO2 absorption deviations (filled: H < 10) | |||||||||||||||||||||||
| 0 | 0 |
|
|
|
|
|
|
| IPAIR | NAME | SHIFT | NEWSHIFT | S/N | NAME | SHIFT | NEWSHIFT | S/N |
| 0 | 03720098 | 0.510559 | 0.00000 | 170.699 | 03720097 | 0.00000 | 0.510559 | 167.913 |
| 1 | 03720107 | 0.499869 | 0.0106900 | 187.523 | 03720108 | 0.000360803 | 0.510198 | 191.246 |
| 2 | 03720106 | 0.498787 | 0.0117720 | 184.705 | 03720105 | -0.000512057 | 0.511071 | 190.318 |
| 3 | 03720099 | 0.510424 | 0.000135005 | 178.234 | 03720104 | -0.000464415 | 0.511023 | 185.631 |
| 4 | 03720102 | 0.500271 | 0.0102880 | 177.912 | 03720101 | 0.00156869 | 0.508990 | 183.551 |
| 5 | 03720103 | 0.501081 | 0.00947803 | 175.800 | 03720100 | 0.000558039 | 0.510001 | 181.834 |