| Red | Green | Blue | |
| z | 17.64 | ||
| znorm | Inf | ||
| sky | -Inf | -Inf | -Inf |
| S/N | 27.3 | 47.5 | 52.8 |
| S/N(c) | 0.0 | 0.0 | 0.0 |
| SN(E/C) |
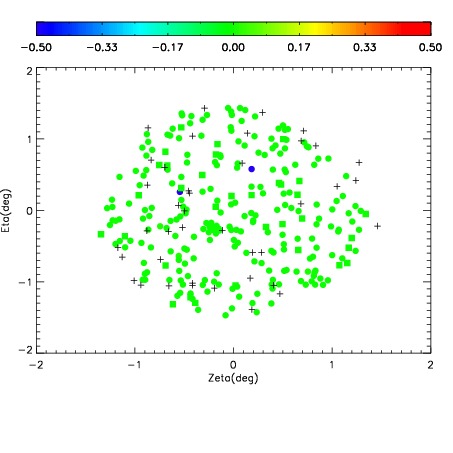
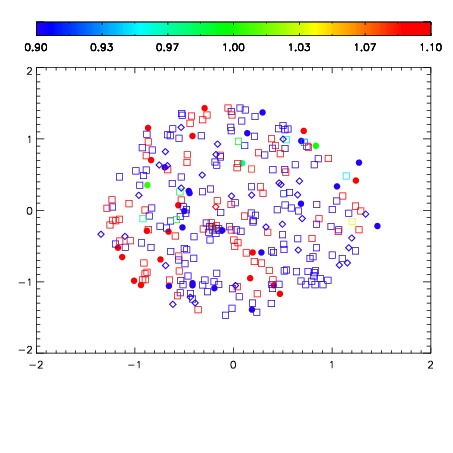


| Frame | Nreads | Zeropoints | Mag plots | Spatial mag deviation | Spatial sky 16325A emission deviations (filled: sky, open: star) | Spatial sky continuum emission | Spatial sky telluric CO2 absorption deviations (filled: H < 10) | |||||||||||||||||||||||
| 0 | 0 |
|
|
|
|
|
|
| IPAIR | NAME | SHIFT | NEWSHIFT | S/N | NAME | SHIFT | NEWSHIFT | S/N |
| 0 | 04060061 | 0.497816 | 0.00000 | 185.256 | 04060062 | -0.00143742 | 0.499253 | 181.400 |
| 1 | 04060060 | 0.494138 | 0.00367799 | 183.836 | 04060059 | 0.00000 | 0.497816 | 177.209 |
| 2 | 04060065 | 0.494791 | 0.00302500 | 180.041 | 04060066 | 0.000774642 | 0.497041 | 169.434 |
| 3 | 04060064 | 0.494118 | 0.00369799 | 174.203 | 04060063 | -0.000994107 | 0.498810 | 157.649 |