| Red | Green | Blue | |
| z | 17.64 | ||
| znorm | Inf | ||
| sky | -Inf | -Inf | -Inf |
| S/N | 29.0 | 49.1 | 52.6 |
| S/N(c) | 0.0 | 0.0 | 0.0 |
| SN(E/C) |
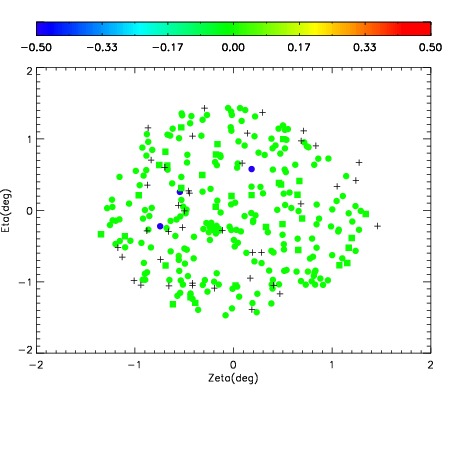
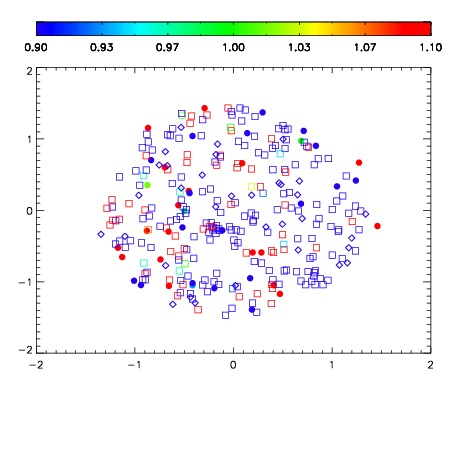
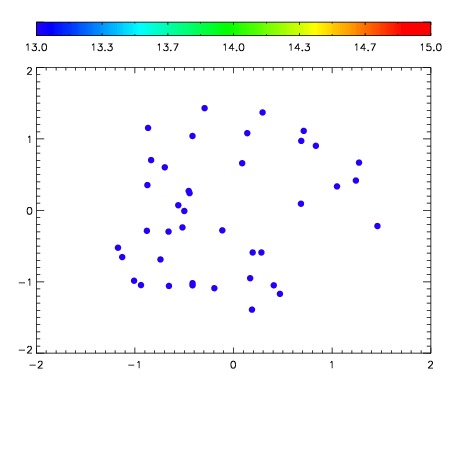

| Frame | Nreads | Zeropoints | Mag plots | Spatial mag deviation | Spatial sky 16325A emission deviations (filled: sky, open: star) | Spatial sky continuum emission | Spatial sky telluric CO2 absorption deviations (filled: H < 10) | |||||||||||||||||||||||
| 0 | 0 |
|
|
|
|
|
|
| IPAIR | NAME | SHIFT | NEWSHIFT | S/N | NAME | SHIFT | NEWSHIFT | S/N |
| 0 | 04620018 | 0.495629 | 0.00000 | 187.193 | 04620020 | -0.000589257 | 0.496218 | 187.171 |
| 1 | 04620017 | 0.494758 | 0.000871003 | 196.028 | 04620016 | 0.00000 | 0.495629 | 195.041 |
| 2 | 04620022 | 0.493370 | 0.00225902 | 189.399 | 04620023 | -0.000918087 | 0.496547 | 189.620 |
| 3 | 04620021 | 0.492990 | 0.00263903 | 186.672 | 04620019 | 0.000576351 | 0.495053 | 184.057 |