| Red | Green | Blue | |
| z | 17.64 | ||
| znorm | Inf | ||
| sky | -Inf | -Inf | -Inf |
| S/N | 22.9 | 41.9 | 47.4 |
| S/N(c) | 0.0 | 0.0 | 0.0 |
| SN(E/C) |
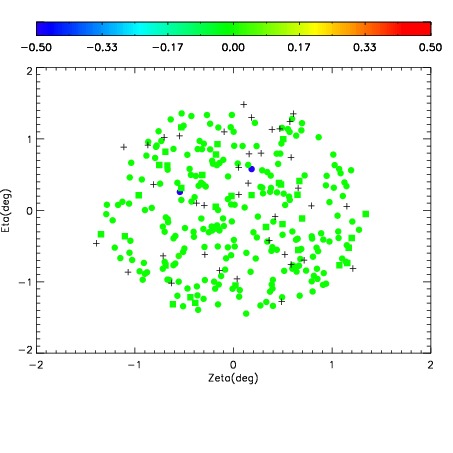
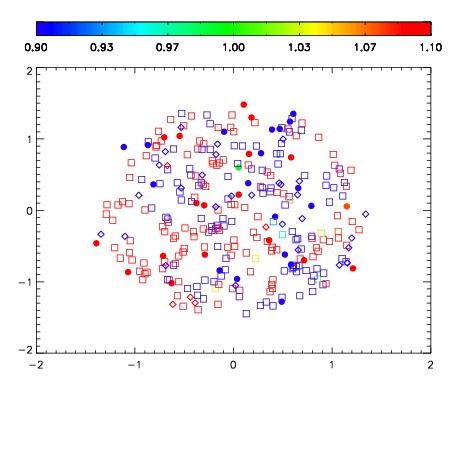
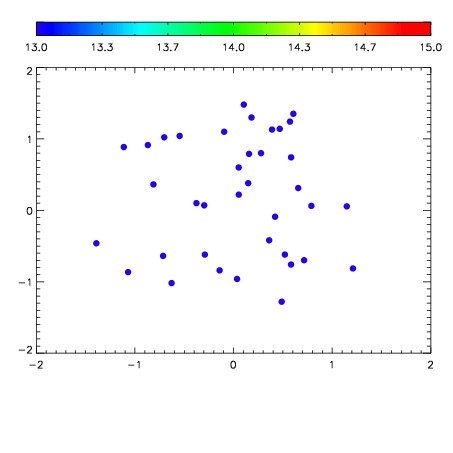

| Frame | Nreads | Zeropoints | Mag plots | Spatial mag deviation | Spatial sky 16325A emission deviations (filled: sky, open: star) | Spatial sky continuum emission | Spatial sky telluric CO2 absorption deviations (filled: H < 10) | |||||||||||||||||||||||
| 0 | 0 |
|
|
|
|
|
|
| IPAIR | NAME | SHIFT | NEWSHIFT | S/N | NAME | SHIFT | NEWSHIFT | S/N |
| 0 | 03760105 | 0.510776 | 0.00000 | 164.907 | 03760106 | 0.00181459 | 0.508961 | 162.040 |
| 1 | 03760100 | 0.509790 | 0.000985980 | 206.790 | 03760099 | 0.00000 | 0.510776 | 204.024 |
| 2 | 03760101 | 0.510591 | 0.000185013 | 199.296 | 03760103 | -0.000952451 | 0.511728 | 194.929 |
| 3 | 03760104 | 0.509733 | 0.00104296 | 170.207 | 03760102 | 0.000338986 | 0.510437 | 181.379 |