| Red | Green | Blue | |
| z | 17.64 | ||
| znorm | Inf | ||
| sky | -Inf | -Inf | -Inf |
| S/N | 28.2 | 49.3 | 54.1 |
| S/N(c) | 0.0 | 0.0 | 0.0 |
| SN(E/C) |
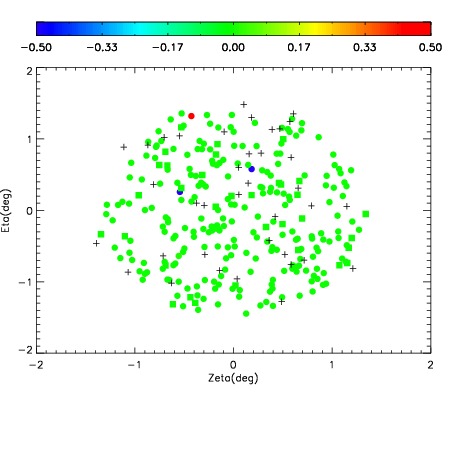
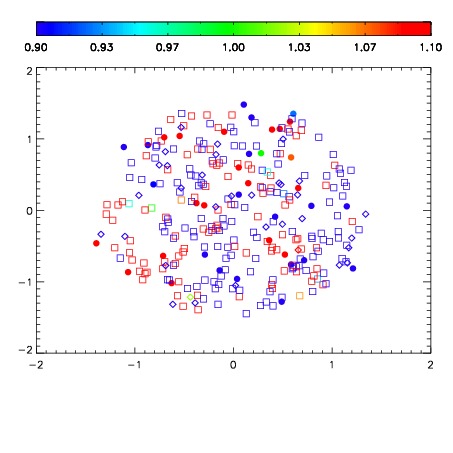
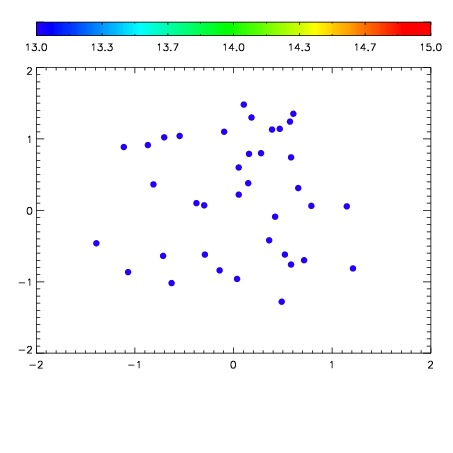

| Frame | Nreads | Zeropoints | Mag plots | Spatial mag deviation | Spatial sky 16325A emission deviations (filled: sky, open: star) | Spatial sky continuum emission | Spatial sky telluric CO2 absorption deviations (filled: H < 10) | |||||||||||||||||||||||
| 0 | 0 |
|
|
|
|
|
|
| IPAIR | NAME | SHIFT | NEWSHIFT | S/N | NAME | SHIFT | NEWSHIFT | S/N |
| 0 | 04670012 | 0.498091 | 0.00000 | 217.146 | 04670013 | 0.00146068 | 0.496630 | 214.500 |
| 1 | 04670015 | 0.496263 | 0.00182801 | 221.438 | 04670017 | 5.97371e-05 | 0.498031 | 218.729 |
| 2 | 04670016 | 0.496650 | 0.00144100 | 219.737 | 04670014 | -9.56481e-05 | 0.498187 | 216.651 |
| 3 | 04670011 | 0.498060 | 3.10242e-05 | 214.430 | 04670010 | 0.00000 | 0.498091 | 210.233 |