| Red | Green | Blue | |
| z | 17.64 | ||
| znorm | Inf | ||
| sky | -Inf | -Inf | -Inf |
| S/N | 27.5 | 49.6 | 54.1 |
| S/N(c) | 0.0 | 0.0 | 0.0 |
| SN(E/C) |
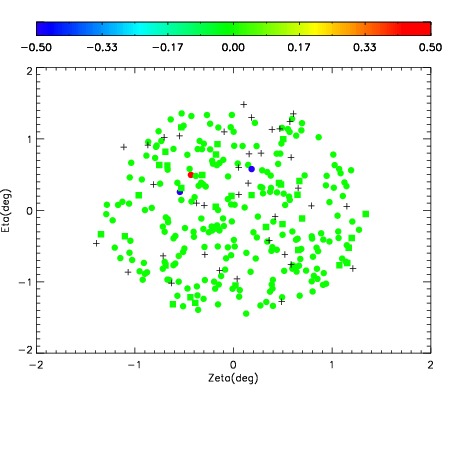
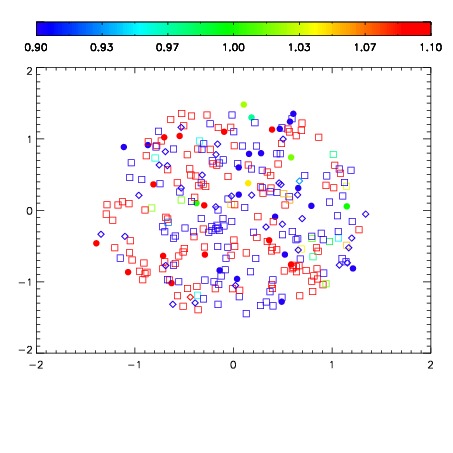
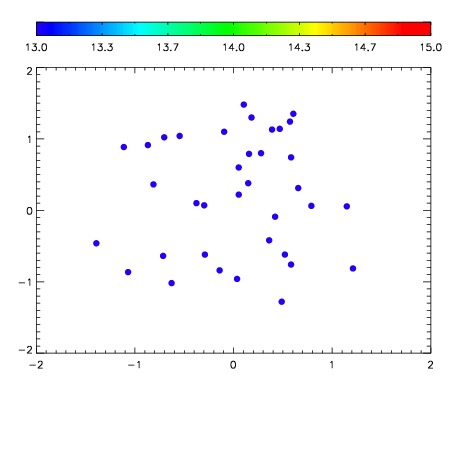

| Frame | Nreads | Zeropoints | Mag plots | Spatial mag deviation | Spatial sky 16325A emission deviations (filled: sky, open: star) | Spatial sky continuum emission | Spatial sky telluric CO2 absorption deviations (filled: H < 10) | |||||||||||||||||||||||
| 0 | 0 |
|
|
|
|
|
|
| IPAIR | NAME | SHIFT | NEWSHIFT | S/N | NAME | SHIFT | NEWSHIFT | S/N |
| 0 | 04860051 | 0.491440 | 0.00000 | 231.163 | 04860052 | 0.00152062 | 0.489919 | 231.478 |
| 1 | 04860050 | 0.489069 | 0.00237098 | 233.267 | 04860049 | 0.00000 | 0.491440 | 231.867 |
| 2 | 04860054 | 0.490905 | 0.000535011 | 225.259 | 04860053 | -0.000437035 | 0.491877 | 227.390 |
| 3 | 04860055 | 0.491337 | 0.000102997 | 222.860 | 04860056 | -0.00621557 | 0.497656 | 218.548 |