| Red | Green | Blue | |
| z | 17.64 | ||
| znorm | Inf | ||
| sky | -Inf | -Inf | -Inf |
| S/N | 21.7 | 39.0 | 41.0 |
| S/N(c) | 0.0 | 0.0 | 0.0 |
| SN(E/C) |
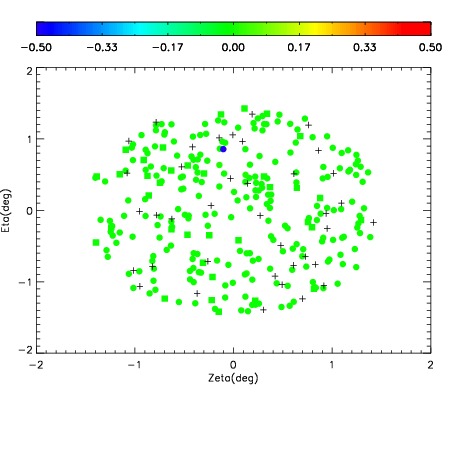
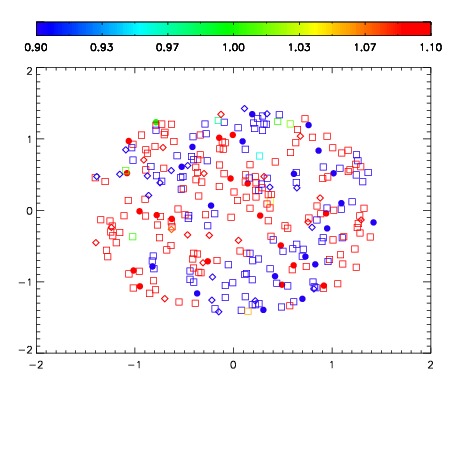
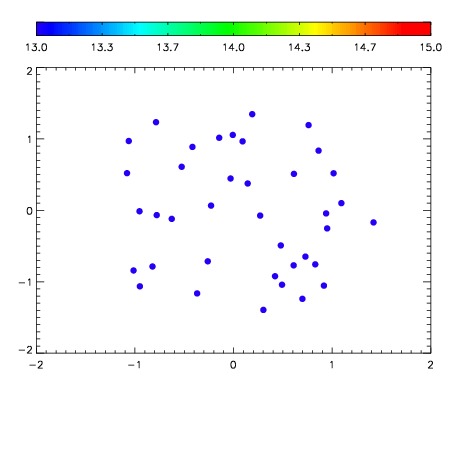

| Frame | Nreads | Zeropoints | Mag plots | Spatial mag deviation | Spatial sky 16325A emission deviations (filled: sky, open: star) | Spatial sky continuum emission | Spatial sky telluric CO2 absorption deviations (filled: H < 10) | |||||||||||||||||||||||
| 0 | 0 |
|
|
|
|
|
|
| IPAIR | NAME | SHIFT | NEWSHIFT | S/N | NAME | SHIFT | NEWSHIFT | S/N |
| 0 | 10830035 | 0.492752 | 0.00000 | 148.397 | 10830033 | 0.00000 | 0.492752 | 156.938 |
| 1 | 10830039 | 0.491955 | 0.000796974 | 172.595 | 10830040 | -0.00241498 | 0.495167 | 181.346 |
| 2 | 10830038 | 0.491067 | 0.00168499 | 169.292 | 10830036 | -0.00194044 | 0.494692 | 159.740 |
| 3 | 10830034 | 0.492463 | 0.000288993 | 146.562 | 10830037 | -0.00205091 | 0.494803 | 151.465 |