| Red | Green | Blue | |
| z | 17.64 | ||
| znorm | Inf | ||
| sky | -Inf | -Inf | -Inf |
| S/N | 22.4 | 41.2 | 44.2 |
| S/N(c) | 0.0 | 0.0 | 0.0 |
| SN(E/C) |
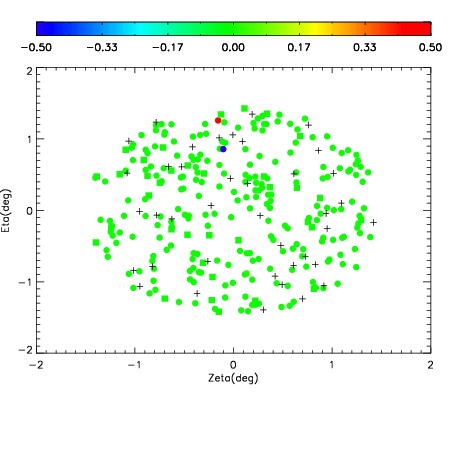
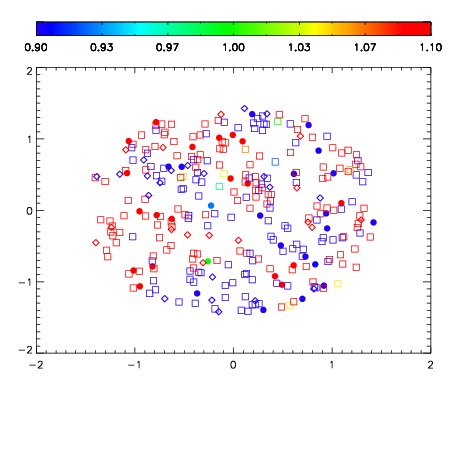
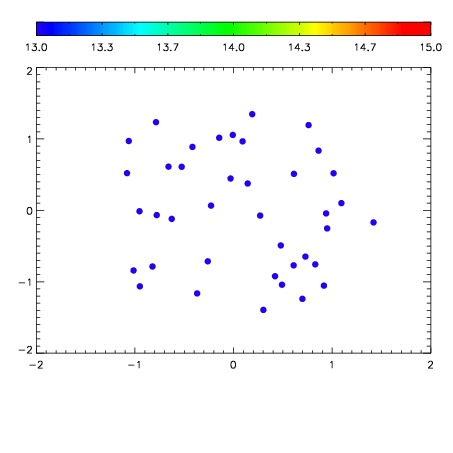

| Frame | Nreads | Zeropoints | Mag plots | Spatial mag deviation | Spatial sky 16325A emission deviations (filled: sky, open: star) | Spatial sky continuum emission | Spatial sky telluric CO2 absorption deviations (filled: H < 10) | |||||||||||||||||||||||
| 0 | 0 |
|
|
|
|
|
|
| IPAIR | NAME | SHIFT | NEWSHIFT | S/N | NAME | SHIFT | NEWSHIFT | S/N |
| 0 | 11070083 | 0.482141 | 0.00000 | 131.084 | 11070082 | 0.000940716 | 0.481200 | 133.498 |
| 1 | 11070075 | 0.479792 | 0.00234899 | 168.530 | 11070074 | 0.00000 | 0.482141 | 162.762 |
| 2 | 11070076 | 0.480105 | 0.00203598 | 162.262 | 11070081 | 0.00104193 | 0.481099 | 160.752 |
| 3 | 11070080 | 0.481783 | 0.000357985 | 158.646 | 11070077 | 0.00175025 | 0.480391 | 156.608 |
| 4 | 11070079 | 0.481641 | 0.000499994 | 144.011 | 11070078 | 0.00309458 | 0.479046 | 152.017 |