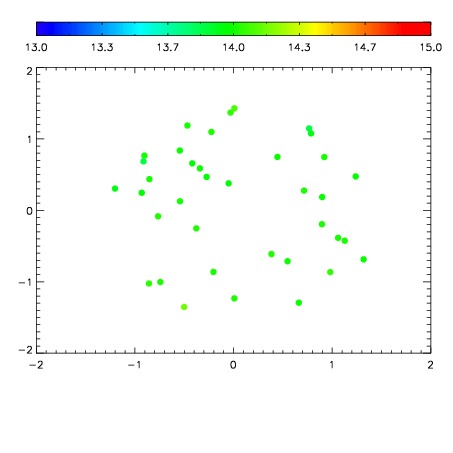
| Frame | Nreads | Zeropoints | Mag plots
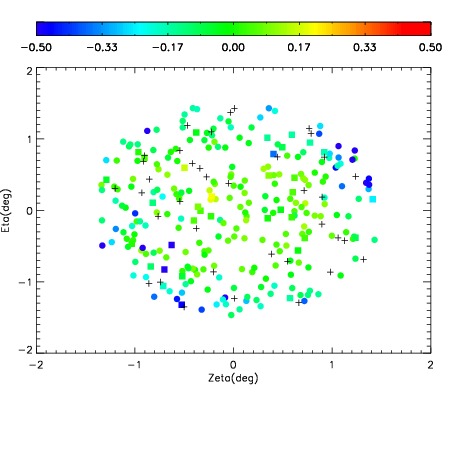
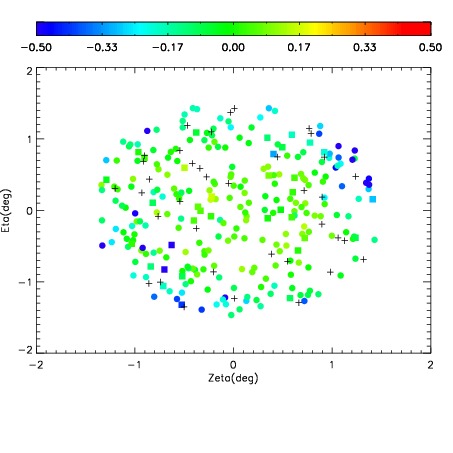
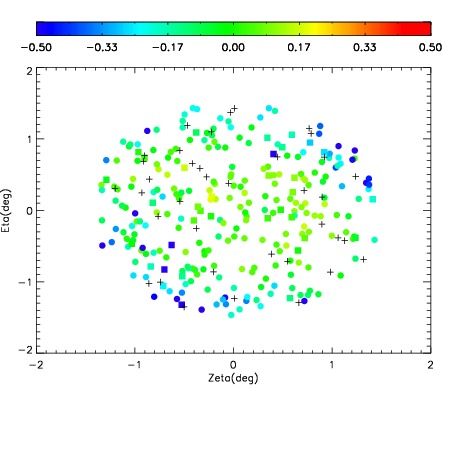
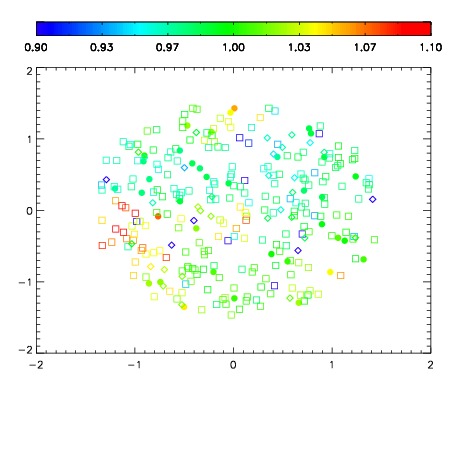
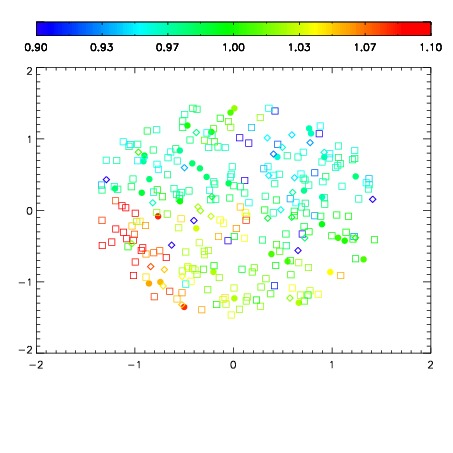
| Spatial mag deviation
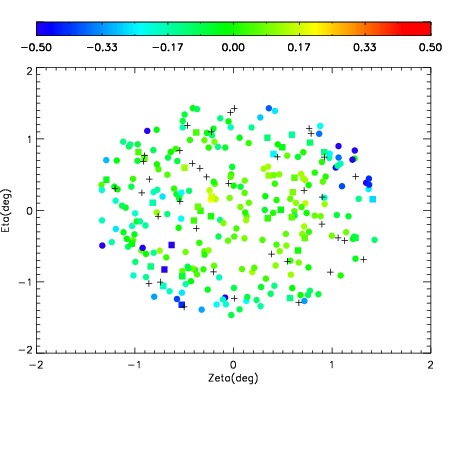
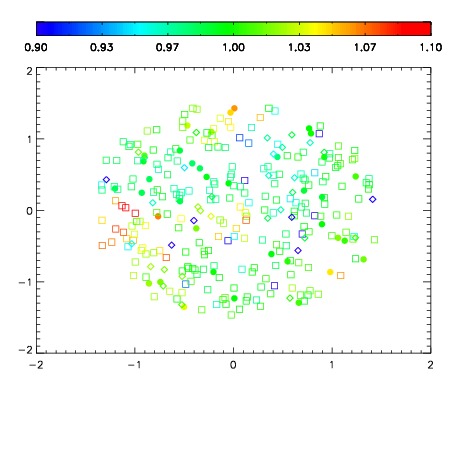
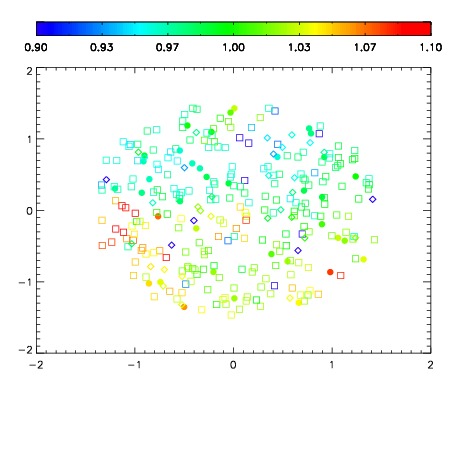
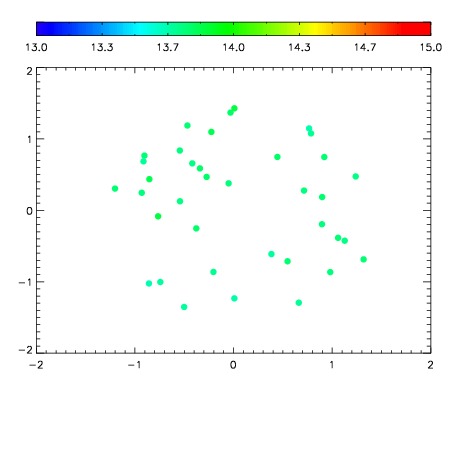
| Spatial sky 16325A emission deviations (filled: sky, open: star)
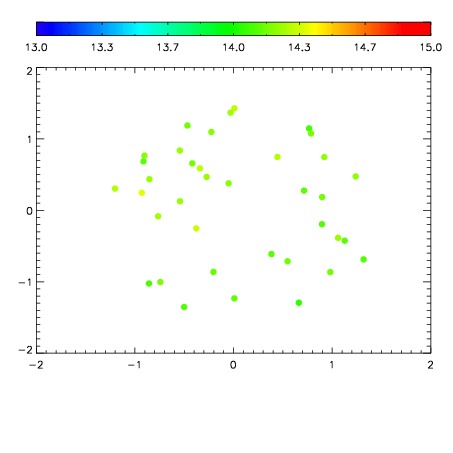
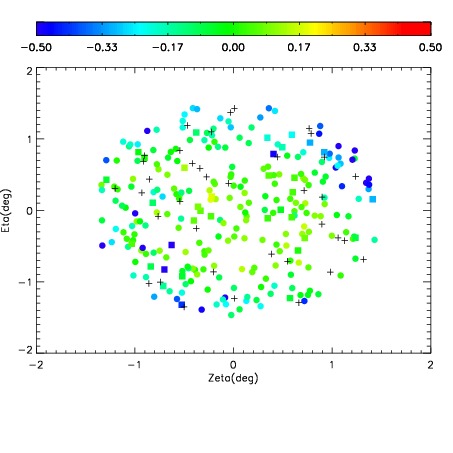
| Spatial sky continuum emission
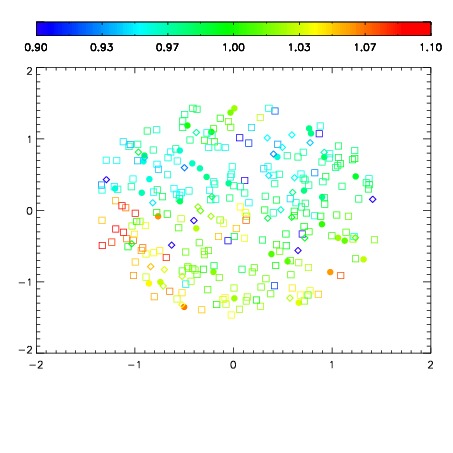
| Spatial sky telluric CO2 absorption deviations (filled: H < 10)
|
| 11390066
| 47
| | Red | Green | Blue
| | z | | 17.80
| | znorm | | 13.62
| | sky | 14.0 | 13.7 | 13.8
| | S/N | 6.1 | 11.1 | 12.4
| | S/N(c) | 5.1 | 9.7 | 11.0
| | SN(E/C) 0.86
|
| 
| 
| 
| 
| 
|
| 11390067
| 47
| | Red | Green | Blue
| | z | | 18.39
| | znorm | | 14.21
| | sky | 14.5 | 14.2 | 14.5
| | S/N | 9.6 | 17.1 | 19.5
| | S/N(c) | 8.2 | 15.4 | 17.8
| | SN(E/C) 0.73
|
| 
| 
| 
| 
| 
|
| 11390068
| 47
| | Red | Green | Blue
| | z | | 18.46
| | znorm | | 14.28
| | sky | 14.5 | 14.3 | 14.5
| | S/N | 10.1 | 18.0 | 20.0
| | S/N(c) | 8.5 | 16.0 | 18.6
| | SN(E/C) 0.69
|
| 
| 
| 
| 
| 
|
| 11390069
| 47
| | Red | Green | Blue
| | z | | 18.63
| | znorm | | 14.45
| | sky | 14.3 | 14.1 | 14.4
| | S/N | 11.6 | 19.8 | 21.5
| | S/N(c) | 10.1 | 17.8 | 19.9
| | SN(E/C) 0.65
|
| 
| 
| 
| 
| 
|
| 11390070
| 47
| | Red | Green | Blue
| | z | | 18.42
| | znorm | | 14.24
| | sky | 14.0 | 13.9 | 14.0
| | S/N | 9.4 | 17.1 | 18.7
| | S/N(c) | 8.2 | 15.5 | 17.3
| | SN(E/C) 0.69
|
| 
| 
| 
| 
| 
|
| 11390071
| 47
| | Red | Green | Blue
| | z | | 18.34
| | znorm | | 14.16
| | sky | 13.9 | 13.8 | 13.9
| | S/N | 9.4 | 16.1 | 17.8
| | S/N(c) | 7.9 | 14.3 | 16.3
| | SN(E/C) 0.72
|
| 
| 
| 
| 
| 
|
| 11390072
| 47
| | Red | Green | Blue
| | z | | 18.51
| | znorm | | 14.33
| | sky | 14.2 | 14.0 | 14.1
| | S/N | 10.5 | 18.2 | 19.8
| | S/N(c) | 9.0 | 16.2 | 18.2
| | SN(E/C) 0.66
|
| 
| 
| 
| 
| 
|
| 11390073
| 47
| | Red | Green | Blue
| | z | | 18.62
| | znorm | | 14.44
| | sky | 14.3 | 14.1 | 14.2
| | S/N | 11.6 | 19.5 | 21.8
| | S/N(c) | 9.8 | 17.4 | 19.9
| | SN(E/C) 0.67
|
| 
| 
| 
| 
| 
|