| Red | Green | Blue | |
| z | 17.64 | ||
| znorm | Inf | ||
| sky | -Inf | -Inf | -Inf |
| S/N | 16.8 | 31.1 | 35.3 |
| S/N(c) | 0.0 | 0.0 | 0.0 |
| SN(E/C) |
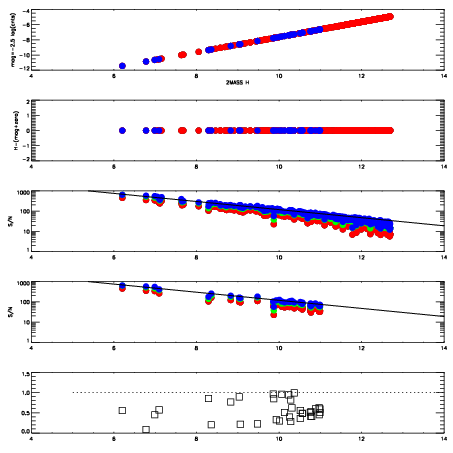
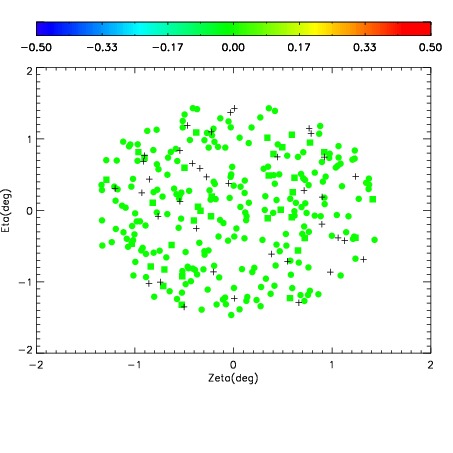
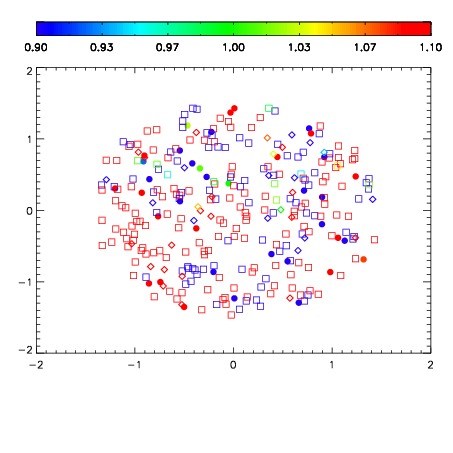
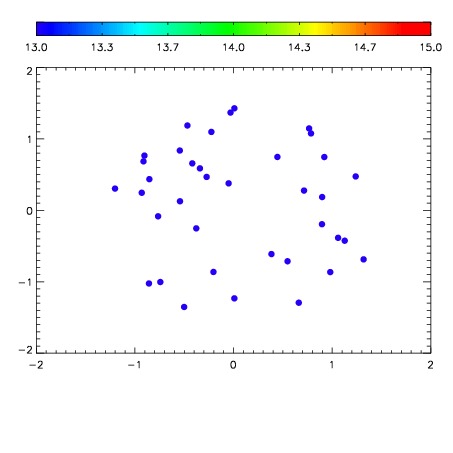

| Frame | Nreads | Zeropoints | Mag plots | Spatial mag deviation | Spatial sky 16325A emission deviations (filled: sky, open: star) | Spatial sky continuum emission | Spatial sky telluric CO2 absorption deviations (filled: H < 10) | |||||||||||||||||||||||
| 0 | 0 |
|
|
|
|
|
|
| IPAIR | NAME | SHIFT | NEWSHIFT | S/N | NAME | SHIFT | NEWSHIFT | S/N |
| 0 | 11390072 | 0.476431 | 0.00000 | 173.847 | 11390069 | -0.000125972 | 0.476557 | 185.429 |
| 1 | 11390068 | 0.475145 | 0.00128600 | 169.952 | 11390073 | 0.00130710 | 0.475124 | 184.267 |
| 2 | 11390067 | 0.474771 | 0.00166002 | 163.607 | 11390070 | -0.000486523 | 0.476918 | 169.487 |
| 3 | 11390071 | 0.475652 | 0.000779003 | 160.608 | 11390066 | 0.00000 | 0.476431 | 123.380 |