| Red | Green | Blue | |
| z | 17.64 | ||
| znorm | Inf | ||
| sky | -Inf | -Inf | -Inf |
| S/N | 17.6 | 31.1 | 36.4 |
| S/N(c) | 0.0 | 0.0 | 0.0 |
| SN(E/C) |
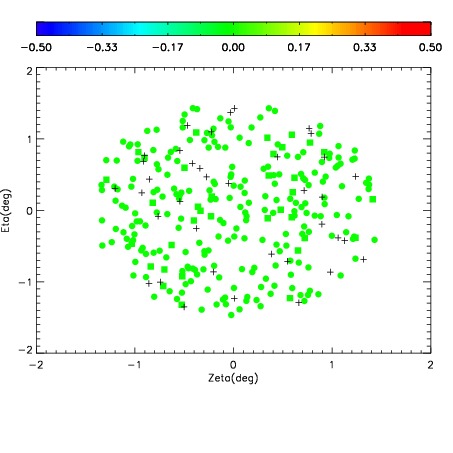
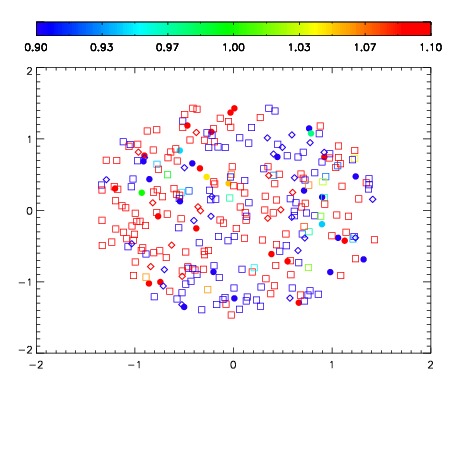
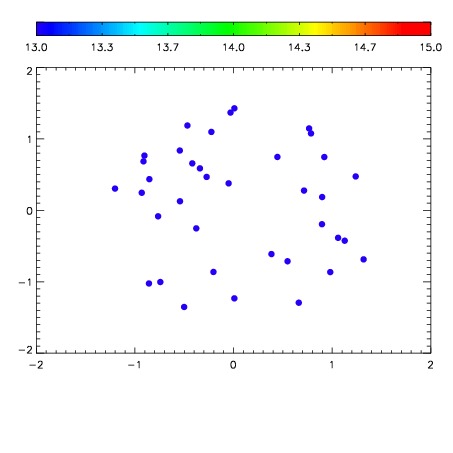

| Frame | Nreads | Zeropoints | Mag plots | Spatial mag deviation | Spatial sky 16325A emission deviations (filled: sky, open: star) | Spatial sky continuum emission | Spatial sky telluric CO2 absorption deviations (filled: H < 10) | |||||||||||||||||||||||
| 0 | 0 |
|
|
|
|
|
|
| IPAIR | NAME | SHIFT | NEWSHIFT | S/N | NAME | SHIFT | NEWSHIFT | S/N |
| 0 | 11450046 | 0.472968 | 0.00000 | 212.200 | 11450044 | 0.00000 | 0.472968 | 217.405 |
| 1 | 11450045 | 0.472526 | 0.000441998 | 206.511 | 11450051 | -0.00791423 | 0.480882 | 206.544 |
| 2 | 11450050 | 0.472620 | 0.000348002 | 157.860 | 11450047 | -0.00710398 | 0.480072 | 173.243 |
| 3 | 11450049 | 0.472302 | 0.000666022 | 148.417 | 11450048 | -0.00686477 | 0.479833 | 124.357 |