| Red | Green | Blue | |
| z | 17.64 | ||
| znorm | Inf | ||
| sky | -NaN | -Inf | -Inf |
| S/N | 13.4 | 23.8 | 26.2 |
| S/N(c) | 0.0 | 0.0 | 0.0 |
| SN(E/C) |

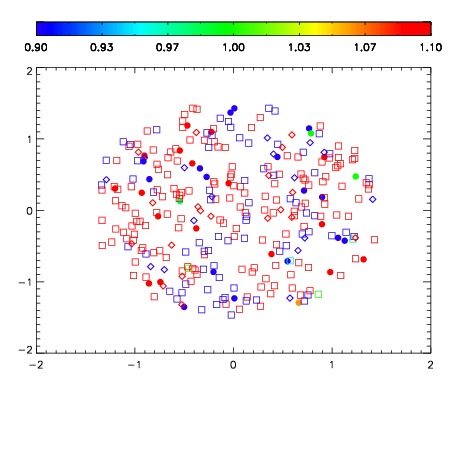
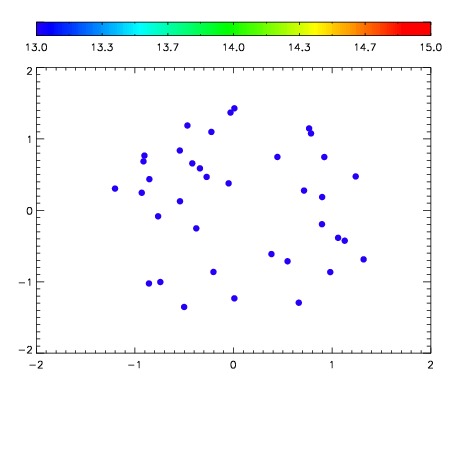

| Frame | Nreads | Zeropoints | Mag plots | Spatial mag deviation | Spatial sky 16325A emission deviations (filled: sky, open: star) | Spatial sky continuum emission | Spatial sky telluric CO2 absorption deviations (filled: H < 10) | |||||||||||||||||||||||
| 0 | 0 |
|
|
|
|
|
|
| IPAIR | NAME | SHIFT | NEWSHIFT | S/N | NAME | SHIFT | NEWSHIFT | S/N |
| 0 | 11720046 | 0.491862 | 0.00000 | 128.630 | 11720047 | -0.00252223 | 0.494384 | 109.743 |
| 1 | 11720049 | 0.491215 | 0.000647008 | 144.504 | 11720051 | -0.00355692 | 0.495419 | 147.160 |
| 2 | 11720050 | 0.490911 | 0.000950992 | 143.193 | 11720048 | -0.00311514 | 0.494977 | 134.913 |
| 3 | 11720045 | 0.491577 | 0.000285000 | 135.643 | 11720044 | 0.00000 | 0.491862 | 129.724 |