| Red | Green | Blue | |
| z | 17.64 | ||
| znorm | Inf | ||
| sky | -Inf | -Inf | -Inf |
| S/N | 25.1 | 44.8 | 49.8 |
| S/N(c) | 0.0 | 0.0 | 0.0 |
| SN(E/C) |
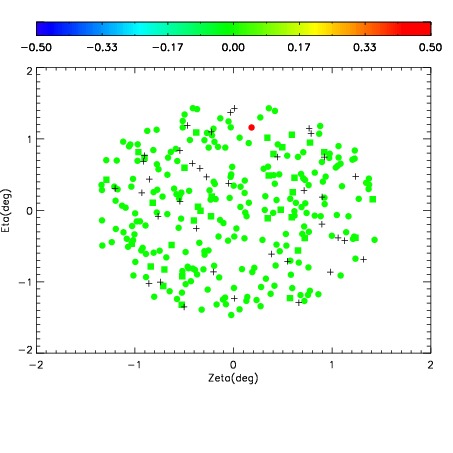
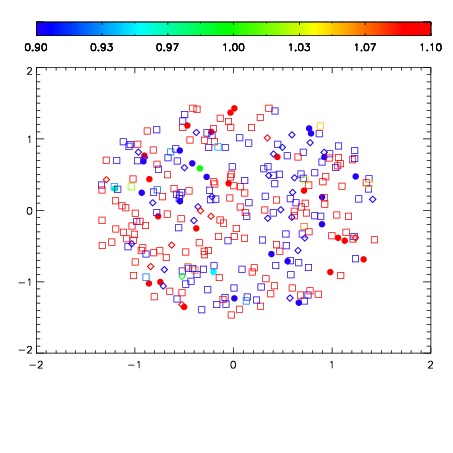
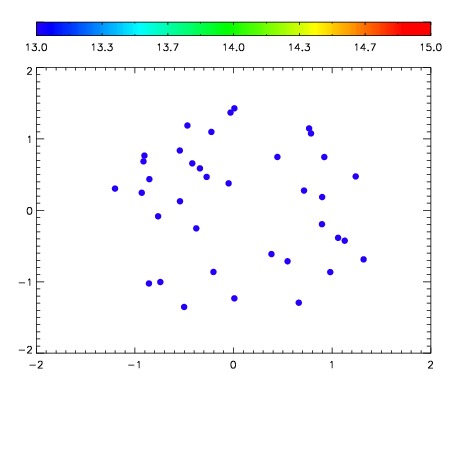

| Frame | Nreads | Zeropoints | Mag plots | Spatial mag deviation | Spatial sky 16325A emission deviations (filled: sky, open: star) | Spatial sky continuum emission | Spatial sky telluric CO2 absorption deviations (filled: H < 10) | |||||||||||||||||||||||
| 0 | 0 |
|
|
|
|
|
|
| IPAIR | NAME | SHIFT | NEWSHIFT | S/N | NAME | SHIFT | NEWSHIFT | S/N |
| 0 | 11950042 | 0.503134 | 0.00000 | 223.801 | 11950040 | -0.00277800 | 0.505912 | 220.243 |
| 1 | 11950041 | 0.502856 | 0.000277996 | 226.014 | 11950043 | -0.00204329 | 0.505177 | 226.992 |
| 2 | 11950038 | 0.500500 | 0.00263399 | 215.581 | 11950039 | -0.00324745 | 0.506381 | 217.377 |
| 3 | 11950037 | 0.501356 | 0.00177801 | 212.151 | 11950036 | 0.00000 | 0.503134 | 211.547 |