| Red | Green | Blue | |
| z | 17.64 | ||
| znorm | Inf | ||
| sky | -Inf | -Inf | -Inf |
| S/N | 20.0 | 36.4 | 44.3 |
| S/N(c) | 0.0 | 0.0 | 0.0 |
| SN(E/C) |
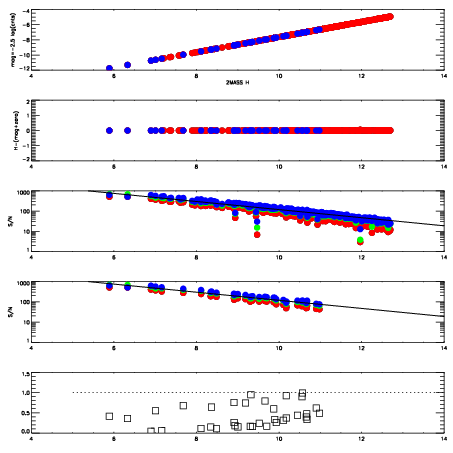
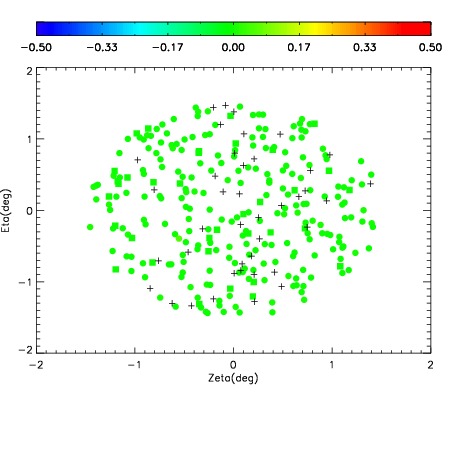
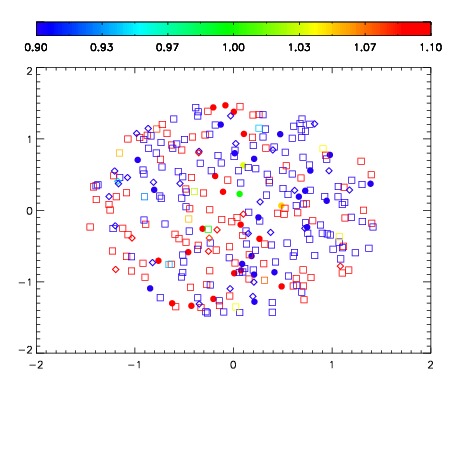
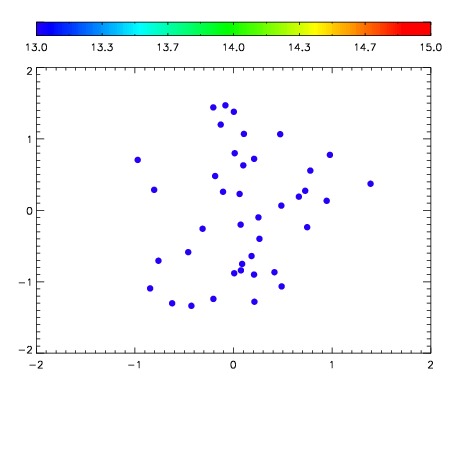

| Frame | Nreads | Zeropoints | Mag plots | Spatial mag deviation | Spatial sky 16325A emission deviations (filled: sky, open: star) | Spatial sky continuum emission | Spatial sky telluric CO2 absorption deviations (filled: H < 10) | |||||||||||||||||||||||
| 0 | 0 |
|
|
|
|
|
|
| IPAIR | NAME | SHIFT | NEWSHIFT | S/N | NAME | SHIFT | NEWSHIFT | S/N |
| 0 | 08730024 | 0.481347 | 0.00000 | 214.363 | 08730026 | -6.42405e-05 | 0.481411 | 222.744 |
| 1 | 08730023 | 0.480906 | 0.000440985 | 216.603 | 08730022 | 0.00000 | 0.481347 | 225.522 |
| 2 | 08730028 | 0.480105 | 0.00124198 | 198.705 | 08730025 | 0.000812313 | 0.480535 | 218.785 |
| 3 | 08730027 | 0.479819 | 0.00152799 | 185.503 | 08730029 | 0.00415301 | 0.477194 | 183.660 |