| Red | Green | Blue | |
| z | 17.64 | ||
| znorm | Inf | ||
| sky | -Inf | -Inf | -Inf |
| S/N | 21.8 | 39.3 | 42.1 |
| S/N(c) | 0.0 | 0.0 | 0.0 |
| SN(E/C) |
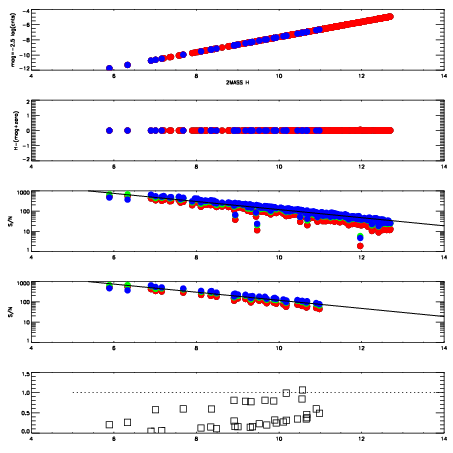

| Frame | Nreads | Zeropoints | Mag plots | Spatial mag deviation | Spatial sky 16325A emission deviations (filled: sky, open: star) | Spatial sky continuum emission | Spatial sky telluric CO2 absorption deviations (filled: H < 10) | |||||||||||||||||||||||
| 0 | 0 |
|
|
|
|
|
|
| IPAIR | NAME | SHIFT | NEWSHIFT | S/N | NAME | SHIFT | NEWSHIFT | S/N |
| 0 | 08770016 | 0.482708 | 0.00000 | 254.981 | 08770017 | 0.00318597 | 0.479522 | 250.496 |
| 1 | 08770015 | 0.482154 | 0.000553995 | 250.935 | 08770014 | 0.00399476 | 0.478713 | 249.463 |
| 2 | 08770012 | 0.480628 | 0.00207999 | 239.834 | 08770010 | 0.00000 | 0.482708 | 242.587 |
| 3 | 08770011 | 0.480642 | 0.00206602 | 214.818 | 08770013 | 0.00360194 | 0.479106 | 202.736 |