| Red | Green | Blue | |
| z | 17.64 | ||
| znorm | Inf | ||
| sky | -NaN | -Inf | -Inf |
| S/N | 19.2 | 36.2 | 37.9 |
| S/N(c) | 0.0 | 0.0 | 0.0 |
| SN(E/C) |

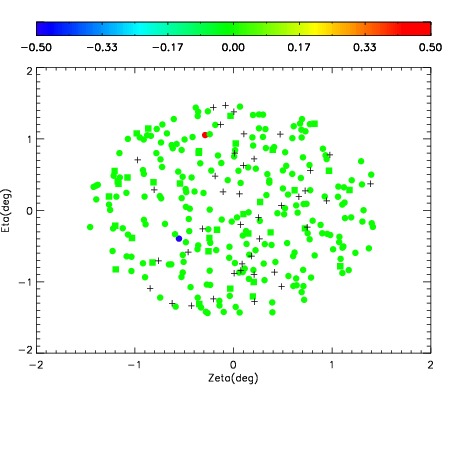
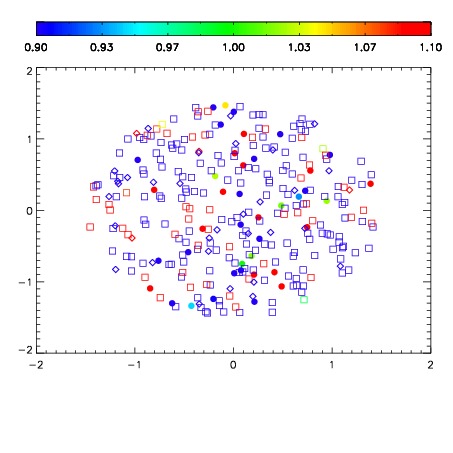
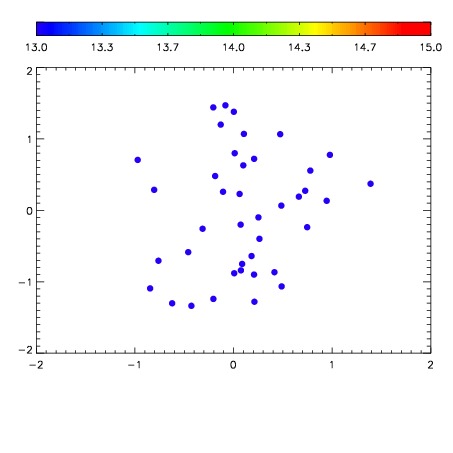

| Frame | Nreads | Zeropoints | Mag plots | Spatial mag deviation | Spatial sky 16325A emission deviations (filled: sky, open: star) | Spatial sky continuum emission | Spatial sky telluric CO2 absorption deviations (filled: H < 10) | |||||||||||||||||||||||
| 0 | 0 |
|
|
|
|
|
|
| IPAIR | NAME | SHIFT | NEWSHIFT | S/N | NAME | SHIFT | NEWSHIFT | S/N |
| 0 | 11190013 | 0.475669 | 0.00000 | 233.965 | 11190014 | -0.00448395 | 0.480153 | 237.150 |
| 1 | 11190016 | 0.474067 | 0.00160199 | 238.233 | 11190015 | -0.00501631 | 0.480685 | 240.741 |
| 2 | 11190012 | 0.475577 | 9.19998e-05 | 231.996 | 11190011 | 0.00000 | 0.475669 | 226.841 |