| Red | Green | Blue | |
| z | 17.64 | ||
| znorm | Inf | ||
| sky | -Inf | -NaN | -Inf |
| S/N | 24.0 | 42.7 | 46.9 |
| S/N(c) | 0.0 | 0.0 | 0.0 |
| SN(E/C) |
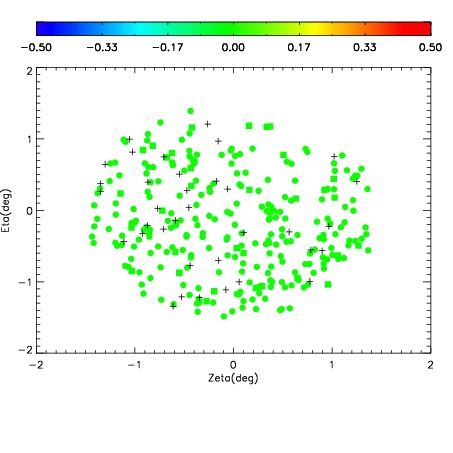
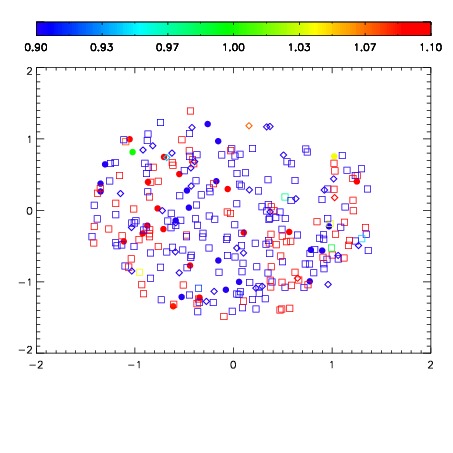
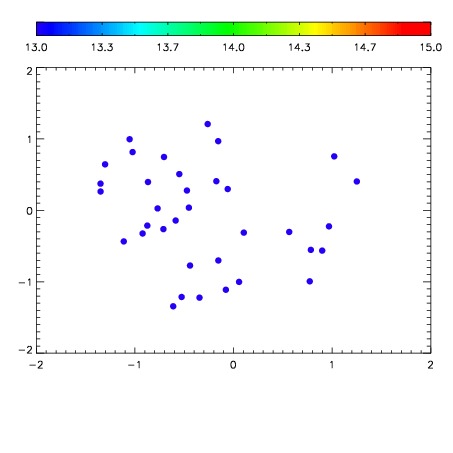

| Frame | Nreads | Zeropoints | Mag plots | Spatial mag deviation | Spatial sky 16325A emission deviations (filled: sky, open: star) | Spatial sky continuum emission | Spatial sky telluric CO2 absorption deviations (filled: H < 10) | |||||||||||||||||||||||
| 0 | 0 |
|
|
|
|
|
|
| IPAIR | NAME | SHIFT | NEWSHIFT | S/N | NAME | SHIFT | NEWSHIFT | S/N |
| 0 | 11650070 | 0.492787 | 0.00000 | 216.532 | 11650069 | -0.00202732 | 0.494814 | 221.370 |
| 1 | 11650071 | 0.492671 | 0.000115991 | 215.136 | 11650068 | -0.00171722 | 0.494504 | 215.839 |
| 2 | 11650067 | 0.492661 | 0.000126004 | 209.856 | 11650072 | -0.00176363 | 0.494551 | 215.093 |
| 3 | 11650066 | 0.491749 | 0.00103801 | 201.031 | 11650065 | 0.00000 | 0.492787 | 189.794 |