| Red | Green | Blue | |
| z | 17.64 | ||
| znorm | Inf | ||
| sky | -Inf | -Inf | -Inf |
| S/N | 27.2 | 47.4 | 53.9 |
| S/N(c) | 0.0 | 0.0 | 0.0 |
| SN(E/C) |
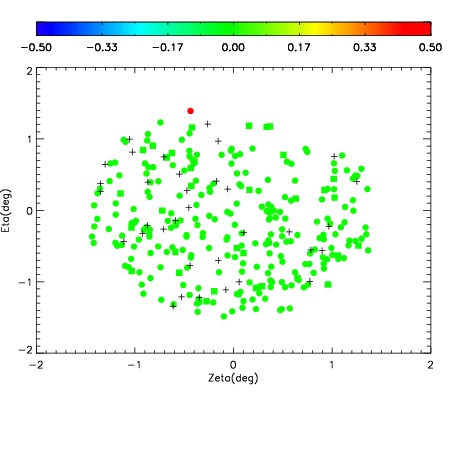
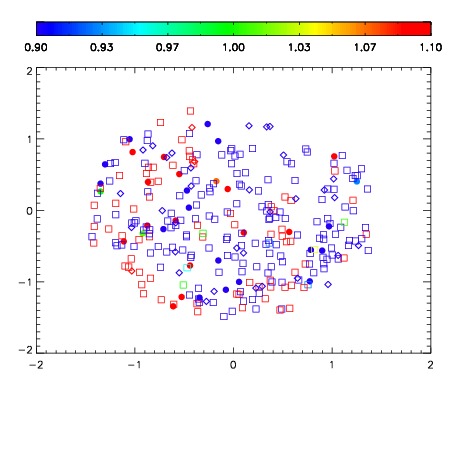
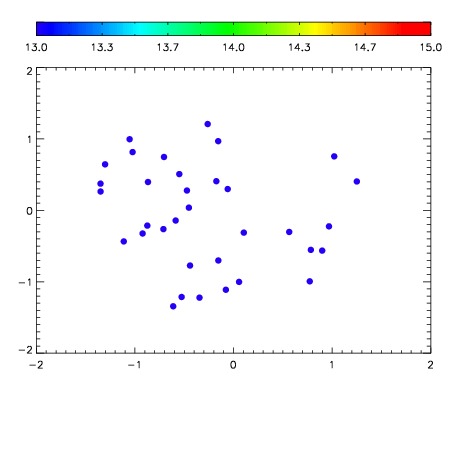

| Frame | Nreads | Zeropoints | Mag plots | Spatial mag deviation | Spatial sky 16325A emission deviations (filled: sky, open: star) | Spatial sky continuum emission | Spatial sky telluric CO2 absorption deviations (filled: H < 10) | |||||||||||||||||||||||
| 0 | 0 |
|
|
|
|
|
|
| IPAIR | NAME | SHIFT | NEWSHIFT | S/N | NAME | SHIFT | NEWSHIFT | S/N |
| 0 | 11950063 | 0.501236 | 0.00000 | 216.481 | 11950062 | -0.00256198 | 0.503798 | 216.984 |
| 1 | 11950064 | 0.501029 | 0.000207007 | 216.291 | 11950065 | -0.00228953 | 0.503526 | 216.514 |
| 2 | 11950060 | 0.500863 | 0.000373006 | 211.538 | 11950061 | -0.00192009 | 0.503156 | 215.090 |
| 3 | 11950059 | 0.499838 | 0.00139803 | 207.817 | 11950058 | 0.00000 | 0.501236 | 199.581 |