| Red | Green | Blue | |
| z | 17.64 | ||
| znorm | Inf | ||
| sky | -Inf | -Inf | -Inf |
| S/N | 16.8 | 31.4 | 34.5 |
| S/N(c) | 0.0 | 0.0 | 0.0 |
| SN(E/C) |
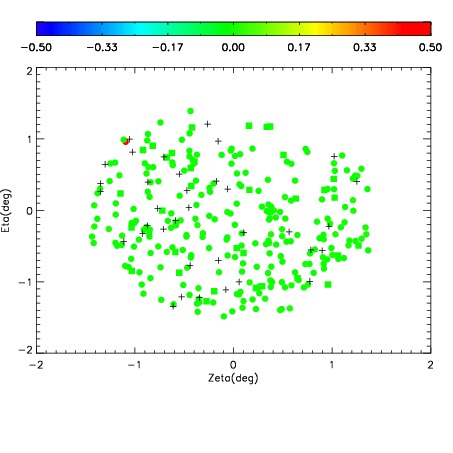
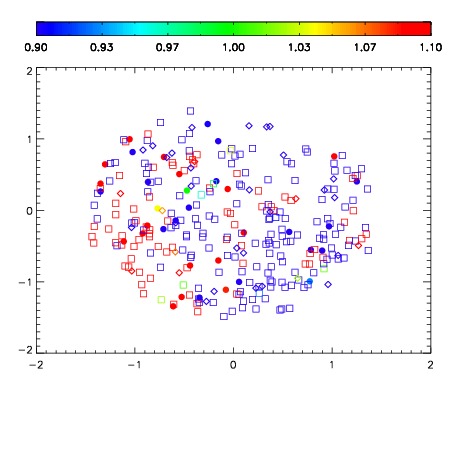
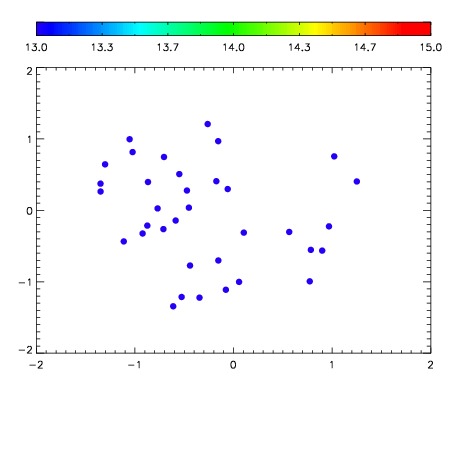

| Frame | Nreads | Zeropoints | Mag plots | Spatial mag deviation | Spatial sky 16325A emission deviations (filled: sky, open: star) | Spatial sky continuum emission | Spatial sky telluric CO2 absorption deviations (filled: H < 10) | |||||||||||||||||||||||
| 0 | 0 |
|
|
|
|
|
|
| IPAIR | NAME | SHIFT | NEWSHIFT | S/N | NAME | SHIFT | NEWSHIFT | S/N |
| 0 | 12030050 | 0.500243 | 0.00000 | 142.395 | 12030048 | 0.00000 | 0.500243 | 151.157 |
| 1 | 12030054 | 0.498533 | 0.00171000 | 185.273 | 12030055 | 0.000117824 | 0.500125 | 186.456 |
| 2 | 12030053 | 0.498308 | 0.00193501 | 175.588 | 12030052 | -0.00357567 | 0.503819 | 176.782 |
| 3 | 12030049 | 0.499672 | 0.000571012 | 150.717 | 12030051 | -0.00334464 | 0.503588 | 165.301 |