| Red | Green | Blue | |
| z | 17.64 | ||
| znorm | Inf | ||
| sky | -Inf | -Inf | -Inf |
| S/N | 20.9 | 40.0 | 42.1 |
| S/N(c) | 0.0 | 0.0 | 0.0 |
| SN(E/C) |
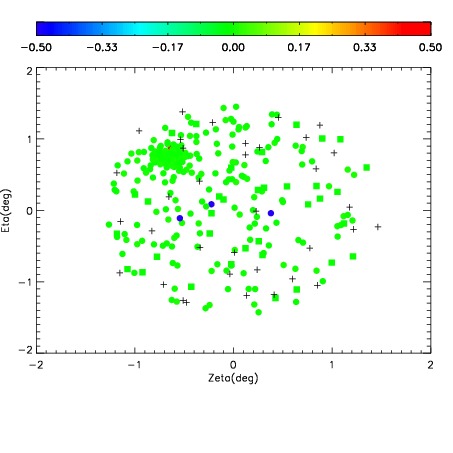
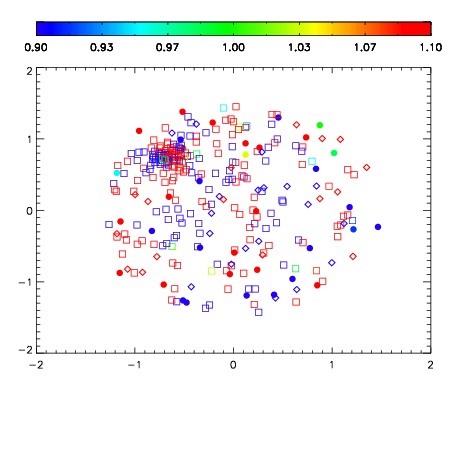
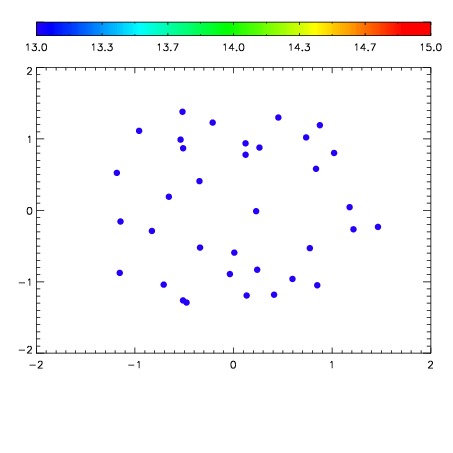

| Frame | Nreads | Zeropoints | Mag plots | Spatial mag deviation | Spatial sky 16325A emission deviations (filled: sky, open: star) | Spatial sky continuum emission | Spatial sky telluric CO2 absorption deviations (filled: H < 10) | |||||||||||||||||||||||
| 0 | 0 |
|
|
|
|
|
|
| IPAIR | NAME | SHIFT | NEWSHIFT | S/N | NAME | SHIFT | NEWSHIFT | S/N |
| 0 | 04670026 | 0.497639 | 0.00000 | 201.729 | 04670029 | 0.00194890 | 0.495690 | 196.739 |
| 1 | 04670027 | 0.497559 | 7.99894e-05 | 202.752 | 04670025 | 0.00000 | 0.497639 | 220.868 |
| 2 | 04670030 | 0.495782 | 0.00185701 | 187.556 | 04670028 | 0.00296722 | 0.494672 | 189.266 |
| 3 | 04670031 | 0.496843 | 0.000795990 | 179.898 | 04670032 | 0.00172337 | 0.495916 | 171.541 |