| Red | Green | Blue | |
| z | 17.64 | ||
| znorm | Inf | ||
| sky | -Inf | -Inf | -Inf |
| S/N | 25.3 | 46.4 | 52.0 |
| S/N(c) | 0.0 | 0.0 | 0.0 |
| SN(E/C) |
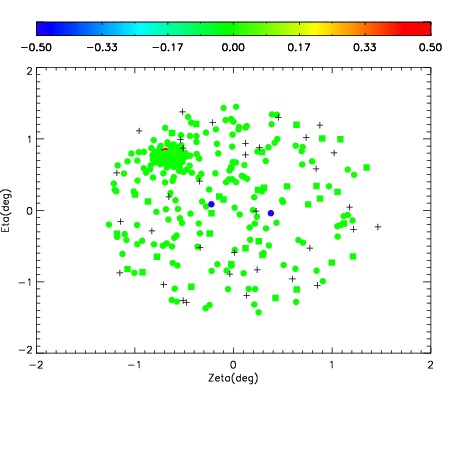
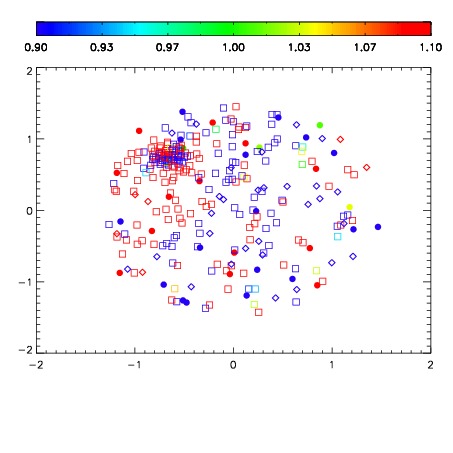
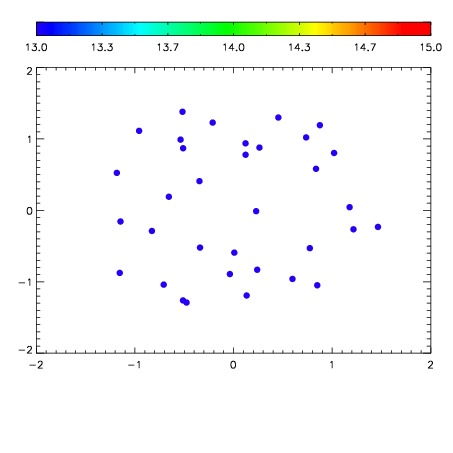

| Frame | Nreads | Zeropoints | Mag plots | Spatial mag deviation | Spatial sky 16325A emission deviations (filled: sky, open: star) | Spatial sky continuum emission | Spatial sky telluric CO2 absorption deviations (filled: H < 10) | |||||||||||||||||||||||
| 0 | 0 |
|
|
|
|
|
|
| IPAIR | NAME | SHIFT | NEWSHIFT | S/N | NAME | SHIFT | NEWSHIFT | S/N |
| 0 | 04870049 | 0.502615 | 0.00000 | 224.507 | 04870055 | 0.000553633 | 0.502061 | 230.008 |
| 1 | 04870050 | 0.502348 | 0.000266969 | 223.795 | 04870051 | -0.000466285 | 0.503081 | 228.297 |
| 2 | 04870054 | 0.499453 | 0.00316197 | 223.353 | 04870052 | -0.000714944 | 0.503330 | 226.711 |
| 3 | 04870053 | 0.498828 | 0.00378698 | 222.102 | 04870048 | 0.00000 | 0.502615 | 226.541 |