| Red | Green | Blue | |
| z | 17.64 | ||
| znorm | Inf | ||
| sky | -Inf | -Inf | -Inf |
| S/N | 33.9 | 60.8 | 65.6 |
| S/N(c) | 0.0 | 0.0 | 0.0 |
| SN(E/C) |

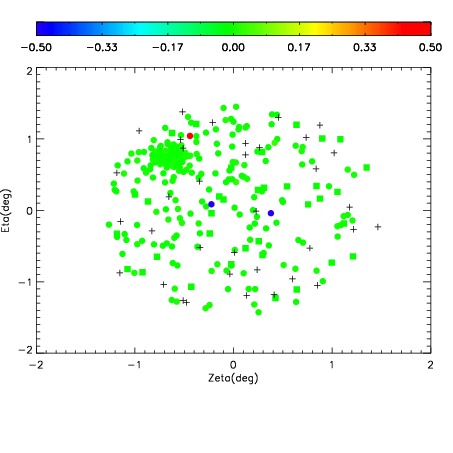
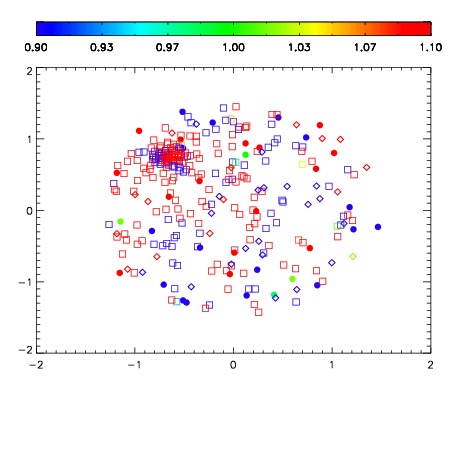
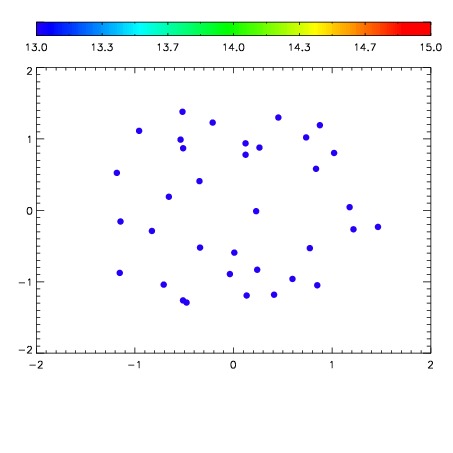

| Frame | Nreads | Zeropoints | Mag plots | Spatial mag deviation | Spatial sky 16325A emission deviations (filled: sky, open: star) | Spatial sky continuum emission | Spatial sky telluric CO2 absorption deviations (filled: H < 10) | |||||||||||||||||||||||
| 0 | 0 |
|
|
|
|
|
|
| IPAIR | NAME | SHIFT | NEWSHIFT | S/N | NAME | SHIFT | NEWSHIFT | S/N |
| 0 | 07530100 | 0.482703 | 0.00000 | 196.639 | 07530102 | 0.00478520 | 0.477918 | 193.838 |
| 1 | 07530096 | 0.480943 | 0.00176001 | 201.590 | 07530094 | 0.00000 | 0.482703 | 206.678 |
| 2 | 07530103 | 0.479566 | 0.00313699 | 197.682 | 07530105 | 0.00343284 | 0.479270 | 202.088 |
| 3 | 07530107 | 0.479704 | 0.00299901 | 197.252 | 07530106 | 0.00498557 | 0.477717 | 196.588 |
| 4 | 07530095 | 0.480033 | 0.00266999 | 196.660 | 07530101 | 0.00445882 | 0.478244 | 194.755 |
| 5 | 07530104 | 0.480846 | 0.00185701 | 193.600 | 07530097 | 0.00234219 | 0.480361 | 192.315 |
| 6 | 07530099 | 0.482131 | 0.000571996 | 184.015 | 07530098 | 0.00131799 | 0.481385 | 175.615 |