| Red | Green | Blue | |
| z | 17.64 | ||
| znorm | Inf | ||
| sky | -Inf | -Inf | -Inf |
| S/N | 23.0 | 41.8 | 45.5 |
| S/N(c) | 0.0 | 0.0 | 0.0 |
| SN(E/C) |
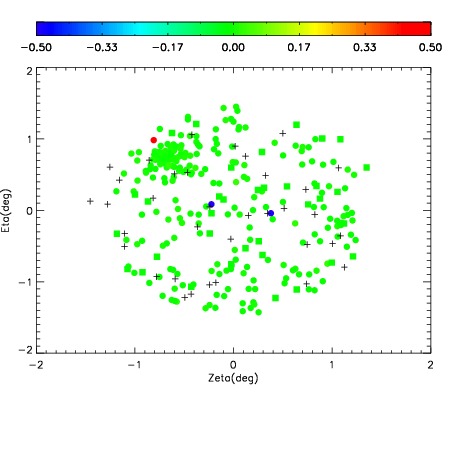
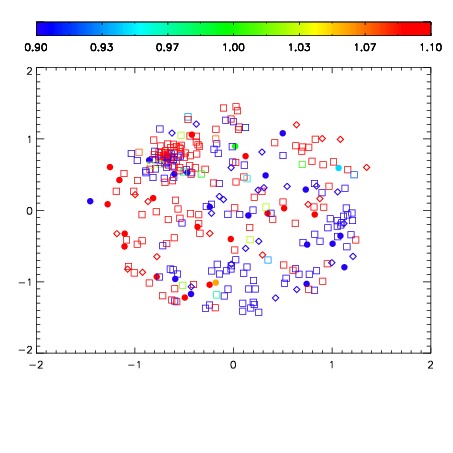
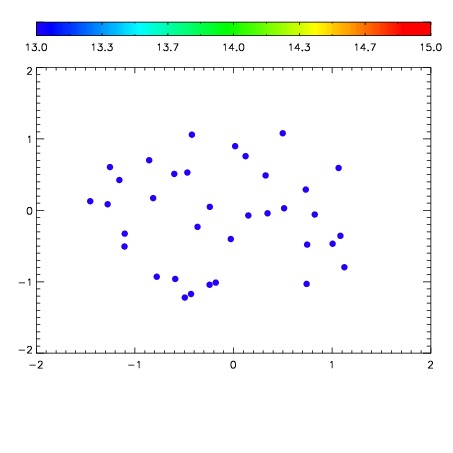

| Frame | Nreads | Zeropoints | Mag plots | Spatial mag deviation | Spatial sky 16325A emission deviations (filled: sky, open: star) | Spatial sky continuum emission | Spatial sky telluric CO2 absorption deviations (filled: H < 10) | |||||||||||||||||||||||
| 0 | 0 |
|
|
|
|
|
|
| IPAIR | NAME | SHIFT | NEWSHIFT | S/N | NAME | SHIFT | NEWSHIFT | S/N |
| 0 | 05210027 | 0.502815 | 0.00000 | 179.826 | 05210026 | 0.00000 | 0.502815 | 186.793 |
| 1 | 05210032 | 0.502048 | 0.000766993 | 175.732 | 05210030 | 0.00110158 | 0.501713 | 176.983 |
| 2 | 05210031 | 0.502188 | 0.000626981 | 171.410 | 05210029 | 0.000612656 | 0.502202 | 163.618 |
| 3 | 05210028 | 0.502426 | 0.000388980 | 166.890 | 05210033 | 0.00149411 | 0.501321 | 140.550 |