| Red | Green | Blue | |
| z | 17.64 | ||
| znorm | Inf | ||
| sky | -Inf | -Inf | -Inf |
| S/N | 24.0 | 43.4 | 48.7 |
| S/N(c) | 0.0 | 0.0 | 0.0 |
| SN(E/C) |
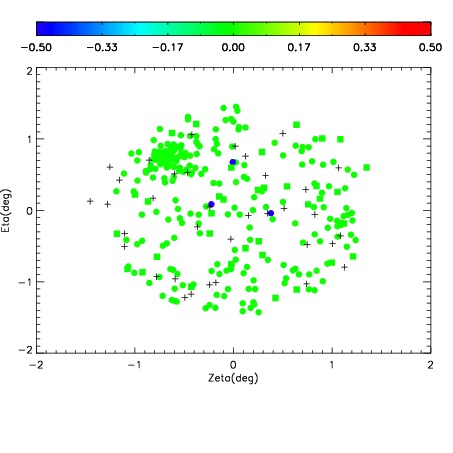
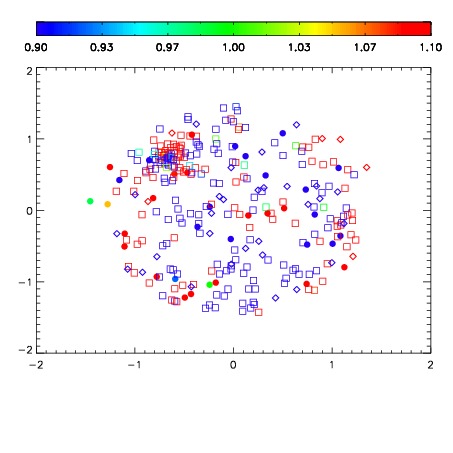
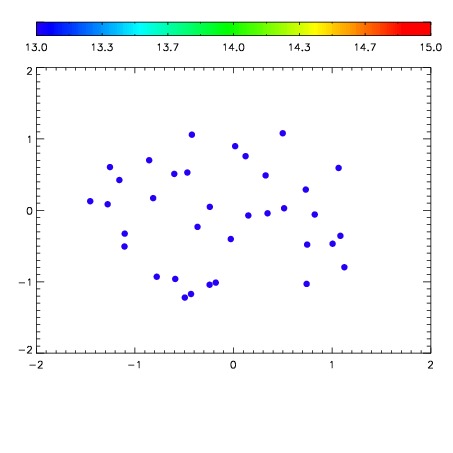

| Frame | Nreads | Zeropoints | Mag plots | Spatial mag deviation | Spatial sky 16325A emission deviations (filled: sky, open: star) | Spatial sky continuum emission | Spatial sky telluric CO2 absorption deviations (filled: H < 10) | |||||||||||||||||||||||
| 0 | 0 |
|
|
|
|
|
|
| IPAIR | NAME | SHIFT | NEWSHIFT | S/N | NAME | SHIFT | NEWSHIFT | S/N |
| 0 | 05490017 | 0.487238 | 0.00000 | 197.753 | 05490011 | 0.00000 | 0.487238 | 195.737 |
| 1 | 05490012 | 0.486973 | 0.000265002 | 200.007 | 05490018 | 0.000217679 | 0.487020 | 200.845 |
| 2 | 05490016 | 0.487130 | 0.000108004 | 199.786 | 05490014 | 0.000887446 | 0.486351 | 200.687 |
| 3 | 05490013 | 0.486605 | 0.000633001 | 195.868 | 05490015 | -0.000350932 | 0.487589 | 193.254 |