| Red | Green | Blue | |
| z | 17.64 | ||
| znorm | Inf | ||
| sky | -Inf | -Inf | -Inf |
| S/N | 34.3 | 60.2 | 65.7 |
| S/N(c) | 0.0 | 0.0 | 0.0 |
| SN(E/C) |
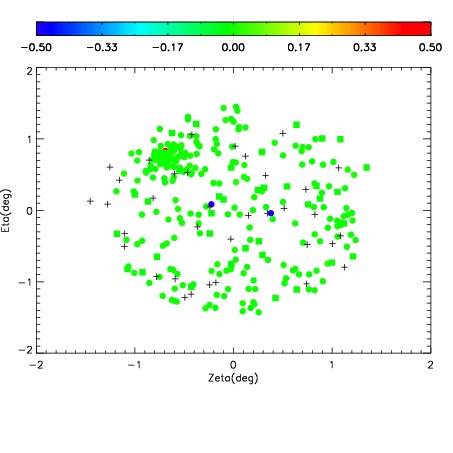
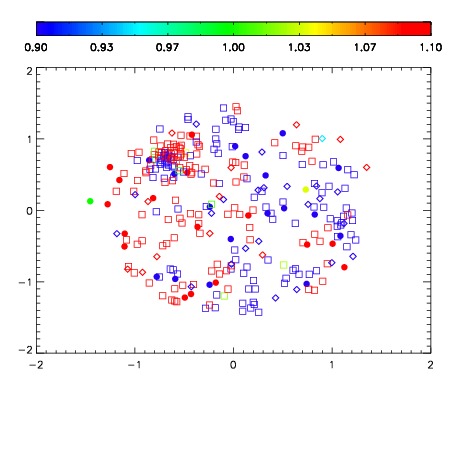
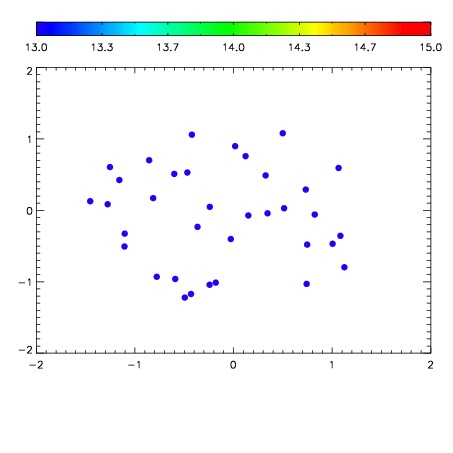

| Frame | Nreads | Zeropoints | Mag plots | Spatial mag deviation | Spatial sky 16325A emission deviations (filled: sky, open: star) | Spatial sky continuum emission | Spatial sky telluric CO2 absorption deviations (filled: H < 10) | |||||||||||||||||||||||
| 0 | 0 |
|
|
|
|
|
|
| IPAIR | NAME | SHIFT | NEWSHIFT | S/N | NAME | SHIFT | NEWSHIFT | S/N |
| 0 | 07540102 | 0.475062 | 0.00000 | 233.287 | 07540099 | -0.00880876 | 0.483871 | 236.429 |
| 1 | 07540101 | 0.474634 | 0.000428021 | 239.184 | 07540107 | 0.00310382 | 0.471958 | 239.012 |
| 2 | 07540105 | 0.473556 | 0.00150600 | 238.256 | 07540104 | 0.000778767 | 0.474283 | 238.362 |
| 3 | 07540106 | 0.473913 | 0.00114900 | 237.414 | 07540100 | 0.00431260 | 0.470749 | 238.276 |
| 4 | 07540097 | 0.473732 | 0.00133002 | 231.445 | 07540103 | 0.00764342 | 0.467419 | 235.435 |
| 5 | 07540098 | 0.474790 | 0.000272006 | 228.054 | 07540096 | 0.00000 | 0.475062 | 226.019 |