| Red | Green | Blue | |
| z | 17.64 | ||
| znorm | Inf | ||
| sky | -Inf | -Inf | -Inf |
| S/N | 29.6 | 54.2 | 60.8 |
| S/N(c) | 0.0 | 0.0 | 0.0 |
| SN(E/C) |

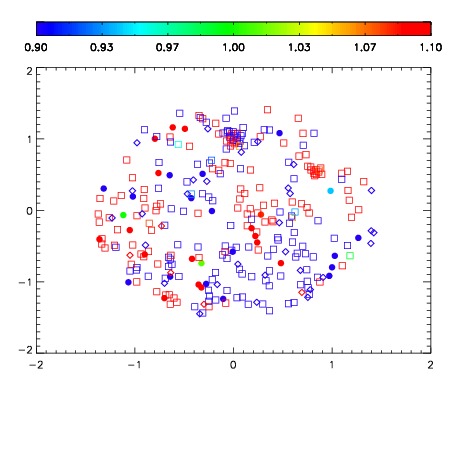
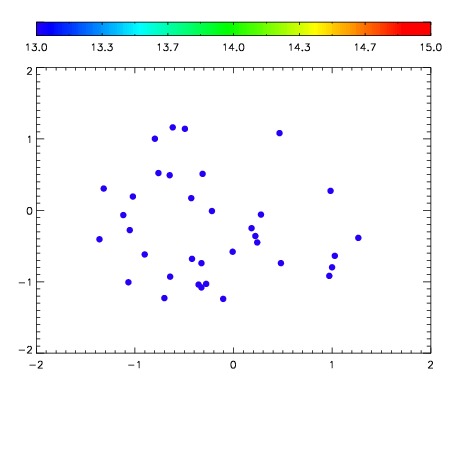

| Frame | Nreads | Zeropoints | Mag plots | Spatial mag deviation | Spatial sky 16325A emission deviations (filled: sky, open: star) | Spatial sky continuum emission | Spatial sky telluric CO2 absorption deviations (filled: H < 10) | |||||||||||||||||||||||
| 0 | 0 |
|
|
|
|
|
|
| IPAIR | NAME | SHIFT | NEWSHIFT | S/N | NAME | SHIFT | NEWSHIFT | S/N |
| 0 | 03710108 | 0.511241 | 0.00000 | 224.704 | 03710101 | 0.00261328 | 0.508628 | 216.079 |
| 1 | 03710099 | 0.502269 | 0.00897199 | 226.345 | 03710098 | 0.00000 | 0.511241 | 220.609 |
| 2 | 03710100 | 0.503660 | 0.00758100 | 225.021 | 03710102 | 0.00169976 | 0.509541 | 219.789 |
| 3 | 03710107 | 0.504939 | 0.00630200 | 222.238 | 03710109 | 0.00501431 | 0.506227 | 213.460 |
| 4 | 03710104 | 0.507720 | 0.00352103 | 220.060 | 03710106 | 0.00478017 | 0.506461 | 209.457 |
| 5 | 03710103 | 0.499355 | 0.0118860 | 215.853 | 03710105 | 0.00287479 | 0.508366 | 208.120 |