| Red | Green | Blue | |
| z | 17.64 | ||
| znorm | Inf | ||
| sky | -Inf | -Inf | -Inf |
| S/N | 26.2 | 47.0 | 49.0 |
| S/N(c) | 0.0 | 0.0 | 0.0 |
| SN(E/C) |
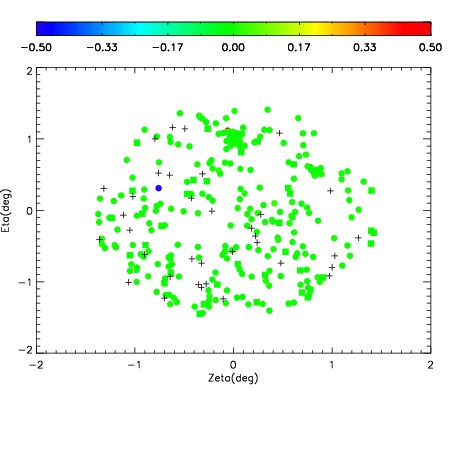
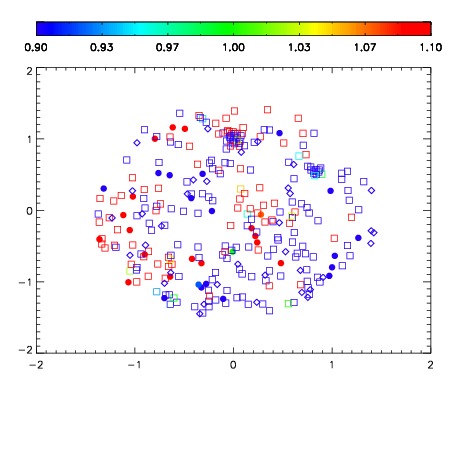
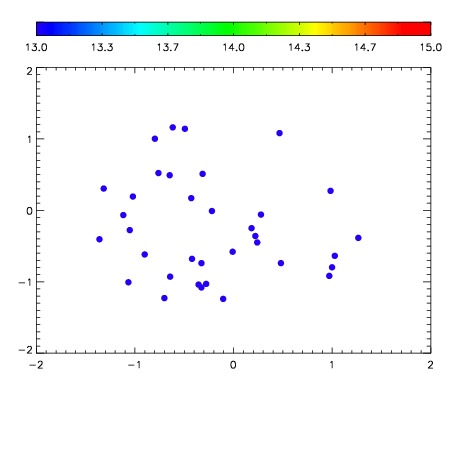

| Frame | Nreads | Zeropoints | Mag plots | Spatial mag deviation | Spatial sky 16325A emission deviations (filled: sky, open: star) | Spatial sky continuum emission | Spatial sky telluric CO2 absorption deviations (filled: H < 10) | |||||||||||||||||||||||
| 0 | 0 |
|
|
|
|
|
|
| IPAIR | NAME | SHIFT | NEWSHIFT | S/N | NAME | SHIFT | NEWSHIFT | S/N |
| 0 | 04040086 | 0.500966 | 0.00000 | 236.952 | 04040087 | 0.00181505 | 0.499151 | 239.898 |
| 1 | 04040090 | 0.500104 | 0.000862002 | 238.526 | 04040088 | 0.000854121 | 0.500112 | 239.980 |
| 2 | 04040085 | 0.500248 | 0.000717998 | 235.819 | 04040084 | 0.00000 | 0.500966 | 235.588 |
| 3 | 04040089 | 0.498941 | 0.00202501 | 233.624 | 04040091 | 0.00169195 | 0.499274 | 219.835 |