| Red | Green | Blue | |
| z | 17.64 | ||
| znorm | Inf | ||
| sky | -Inf | -Inf | -Inf |
| S/N | 31.1 | 55.7 | 63.0 |
| S/N(c) | 0.0 | 0.0 | 0.0 |
| SN(E/C) |
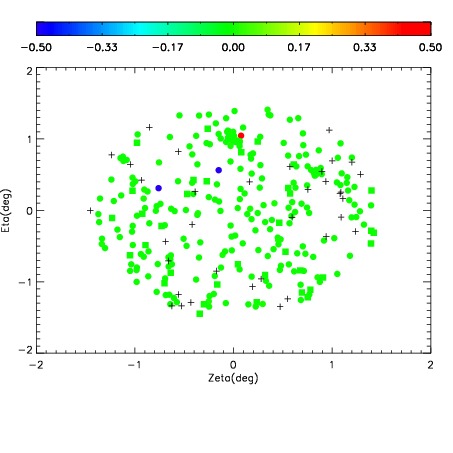
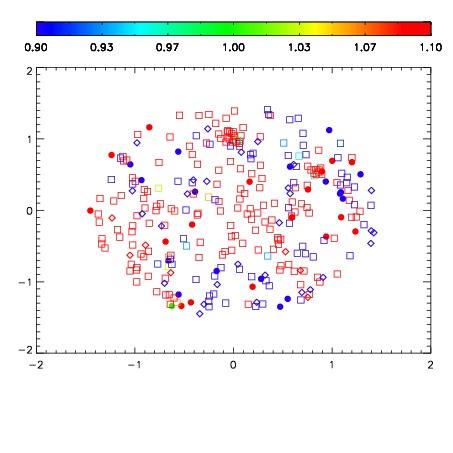
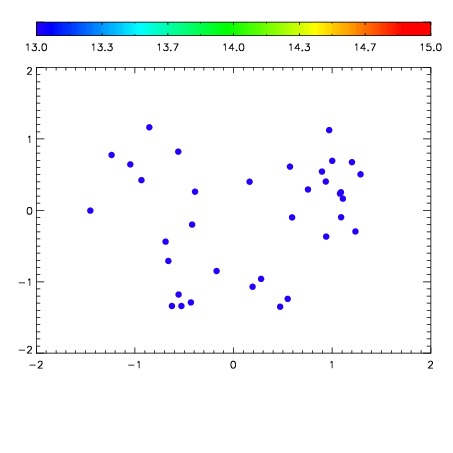

| Frame | Nreads | Zeropoints | Mag plots | Spatial mag deviation | Spatial sky 16325A emission deviations (filled: sky, open: star) | Spatial sky continuum emission | Spatial sky telluric CO2 absorption deviations (filled: H < 10) | |||||||||||||||||||||||
| 0 | 0 |
|
|
|
|
|
|
| IPAIR | NAME | SHIFT | NEWSHIFT | S/N | NAME | SHIFT | NEWSHIFT | S/N |
| 0 | 04050092 | 0.503567 | 0.00000 | 166.130 | 04050093 | 0.00357965 | 0.499987 | 173.757 |
| 1 | 04050091 | 0.502817 | 0.000750005 | 159.708 | 04050090 | 0.00191146 | 0.501656 | 162.096 |
| 2 | 04050088 | 0.500625 | 0.00294197 | 151.989 | 04050089 | 0.00321517 | 0.500352 | 154.456 |
| 3 | 04050087 | 0.499382 | 0.00418499 | 151.466 | 04050085 | 0.00168569 | 0.501881 | 152.284 |
| 4 | 04050084 | 0.498220 | 0.00534698 | 150.928 | 04050086 | 0.00200014 | 0.501567 | 150.249 |
| 5 | 04050083 | 0.496462 | 0.00710499 | 147.727 | 04050082 | 0.00000 | 0.503567 | 146.178 |