| Red | Green | Blue | |
| z | 17.64 | ||
| znorm | Inf | ||
| sky | -Inf | -Inf | -Inf |
| S/N | 23.6 | 42.2 | 48.2 |
| S/N(c) | 0.0 | 0.0 | 0.0 |
| SN(E/C) |
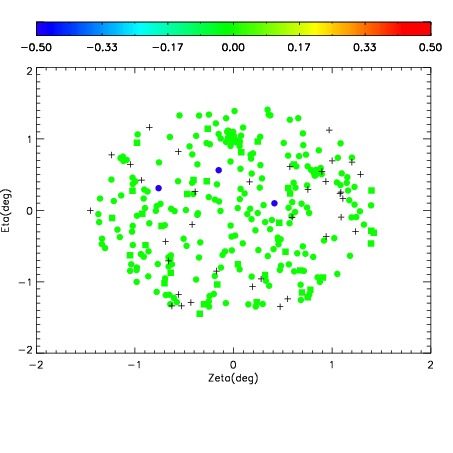
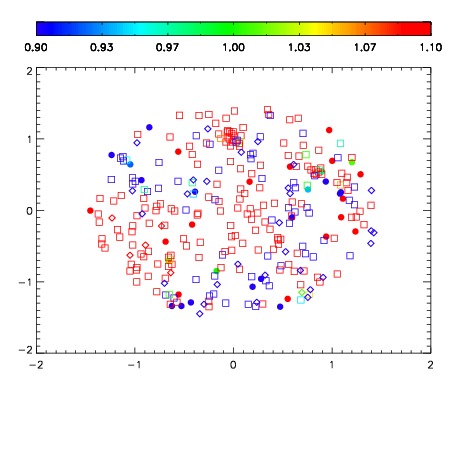
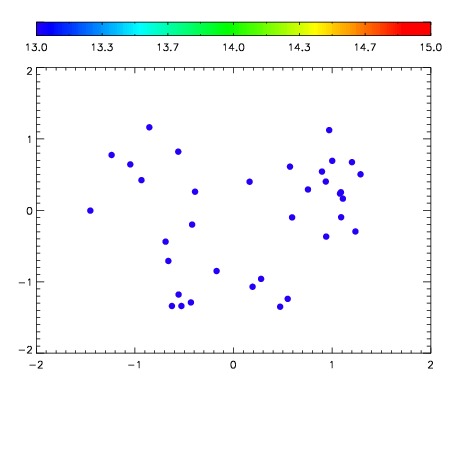

| Frame | Nreads | Zeropoints | Mag plots | Spatial mag deviation | Spatial sky 16325A emission deviations (filled: sky, open: star) | Spatial sky continuum emission | Spatial sky telluric CO2 absorption deviations (filled: H < 10) | |||||||||||||||||||||||
| 0 | 0 |
|
|
|
|
|
|
| IPAIR | NAME | SHIFT | NEWSHIFT | S/N | NAME | SHIFT | NEWSHIFT | S/N |
| 0 | 05190032 | 0.494330 | 0.00000 | 173.672 | 05190033 | 2.34702e-05 | 0.494307 | 180.731 |
| 1 | 05190027 | 0.492795 | 0.00153500 | 172.300 | 05190026 | 0.00000 | 0.494330 | 171.750 |
| 2 | 05190028 | 0.493422 | 0.000907987 | 157.338 | 05190030 | -0.000927890 | 0.495258 | 165.189 |
| 3 | 05190031 | 0.493528 | 0.000801980 | 144.126 | 05190029 | -0.00103947 | 0.495369 | 155.177 |