| Red | Green | Blue | |
| z | 17.64 | ||
| znorm | Inf | ||
| sky | -Inf | -Inf | -Inf |
| S/N | 24.1 | 42.4 | 45.4 |
| S/N(c) | 0.0 | 0.0 | 0.0 |
| SN(E/C) |
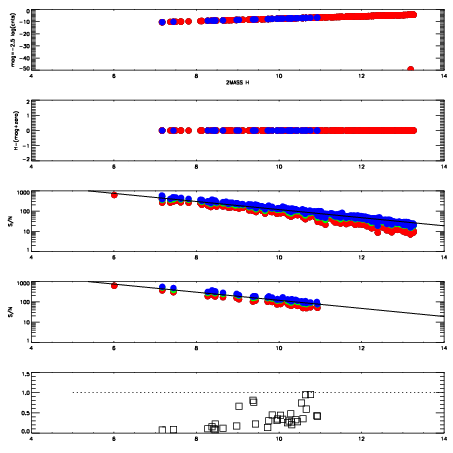
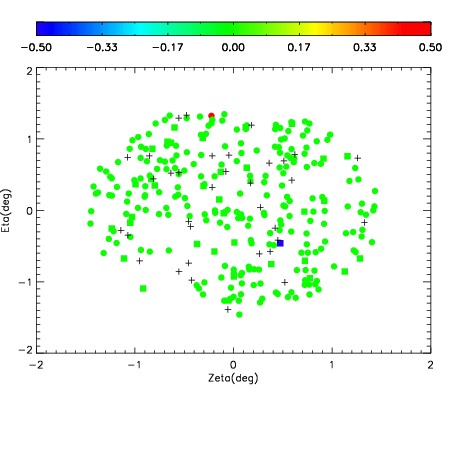
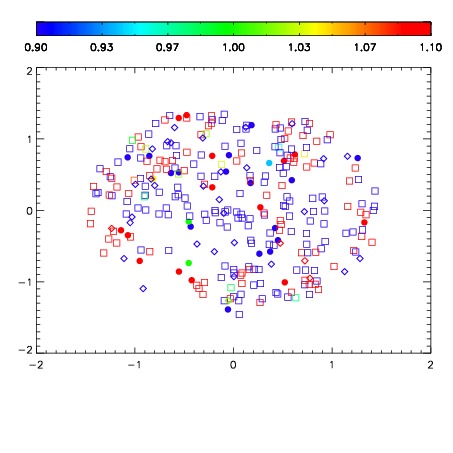
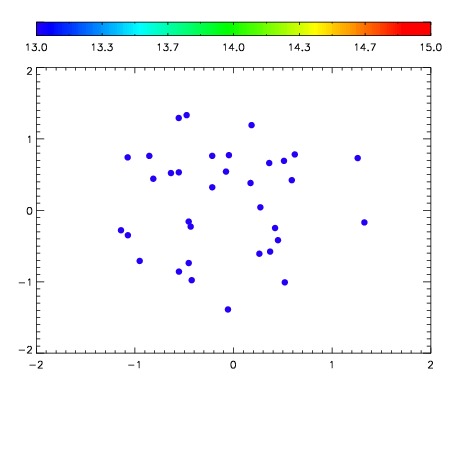

| Frame | Nreads | Zeropoints | Mag plots | Spatial mag deviation | Spatial sky 16325A emission deviations (filled: sky, open: star) | Spatial sky continuum emission | Spatial sky telluric CO2 absorption deviations (filled: H < 10) | |||||||||||||||||||||||
| 0 | 0 |
|
|
|
|
|
|
| IPAIR | NAME | SHIFT | NEWSHIFT | S/N | NAME | SHIFT | NEWSHIFT | S/N |
| 0 | 04300031 | 0.492825 | 0.00000 | 184.738 | 04300029 | 0.000775253 | 0.492050 | 177.641 |
| 1 | 04300027 | 0.491114 | 0.00171101 | 204.545 | 04300032 | 0.00125434 | 0.491571 | 197.277 |
| 2 | 04300026 | 0.490179 | 0.00264600 | 198.854 | 04300025 | 0.00000 | 0.492825 | 195.548 |
| 3 | 04300030 | 0.492056 | 0.000768989 | 138.173 | 04300028 | 0.00113760 | 0.491687 | 167.192 |