| Red | Green | Blue | |
| z | 17.64 | ||
| znorm | Inf | ||
| sky | -NaN | -NaN | -Inf |
| S/N | 25.3 | 46.6 | 51.8 |
| S/N(c) | 0.0 | 0.0 | 0.0 |
| SN(E/C) |

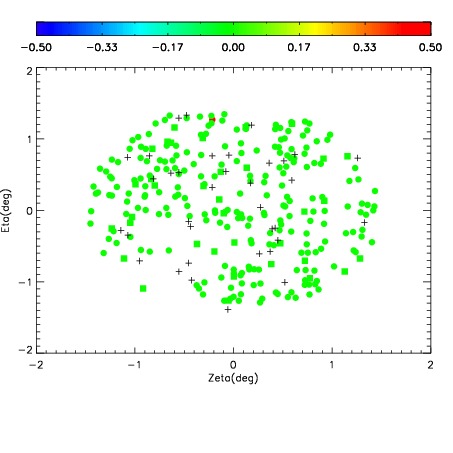
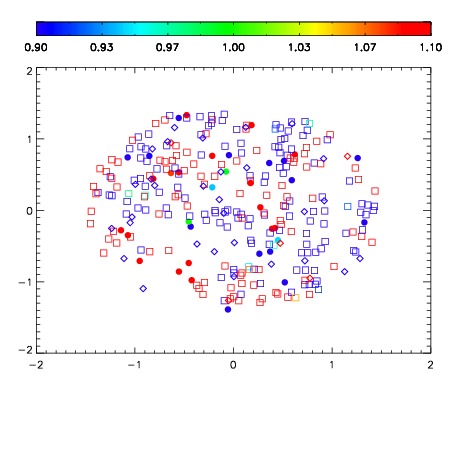


| Frame | Nreads | Zeropoints | Mag plots | Spatial mag deviation | Spatial sky 16325A emission deviations (filled: sky, open: star) | Spatial sky continuum emission | Spatial sky telluric CO2 absorption deviations (filled: H < 10) | |||||||||||||||||||||||
| 0 | 0 |
|
|
|
|
|
|
| IPAIR | NAME | SHIFT | NEWSHIFT | S/N | NAME | SHIFT | NEWSHIFT | S/N |
| 0 | 04860045 | 0.496418 | 0.00000 | 233.587 | 04860046 | 0.00694206 | 0.489476 | 229.056 |
| 1 | 04860044 | 0.495176 | 0.00124201 | 227.720 | 04860043 | 0.00155570 | 0.494862 | 228.900 |
| 2 | 04860041 | 0.493660 | 0.00275800 | 226.730 | 04860042 | 0.00399288 | 0.492425 | 228.146 |
| 3 | 04860040 | 0.492167 | 0.00425100 | 226.714 | 04860039 | 0.00000 | 0.496418 | 221.525 |