| Red | Green | Blue | |
| z | 17.64 | ||
| znorm | Inf | ||
| sky | -NaN | -Inf | -Inf |
| S/N | 12.6 | 19.4 | 23.6 |
| S/N(c) | 0.0 | 0.0 | 0.0 |
| SN(E/C) |

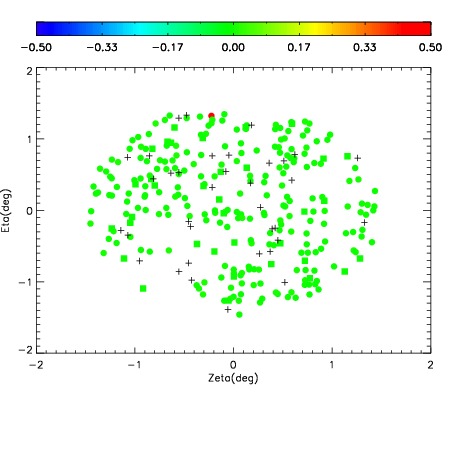

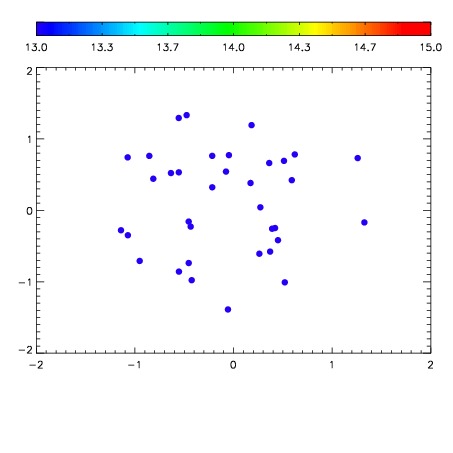

| Frame | Nreads | Zeropoints | Mag plots | Spatial mag deviation | Spatial sky 16325A emission deviations (filled: sky, open: star) | Spatial sky continuum emission | Spatial sky telluric CO2 absorption deviations (filled: H < 10) | |||||||||||||||||||||||
| 0 | 0 |
|
|
|
|
|
|
| IPAIR | NAME | SHIFT | NEWSHIFT | S/N | NAME | SHIFT | NEWSHIFT | S/N |
| 0 | 04910042 | 0.486694 | 0.00000 | 166.011 | 04910043 | 0.00259916 | 0.484095 | 212.668 |
| 1 | 04910037 | 0.485563 | 0.00113100 | 151.050 | 04910036 | 0.00000 | 0.486694 | 200.127 |
| 2 | 04910041 | 0.485148 | 0.00154600 | 143.862 | 04910040 | 0.000300105 | 0.486394 | 167.858 |
| 3 | 04910038 | 0.486324 | 0.000369996 | 121.188 | 04910039 | 0.00229683 | 0.484397 | 127.131 |