| Red | Green | Blue | |
| z | 17.64 | ||
| znorm | Inf | ||
| sky | -Inf | -Inf | -Inf |
| S/N | 27.1 | 46.8 | 55.3 |
| S/N(c) | 0.0 | 0.0 | 0.0 |
| SN(E/C) |
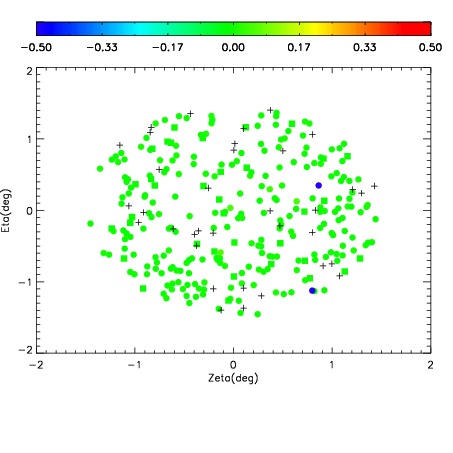
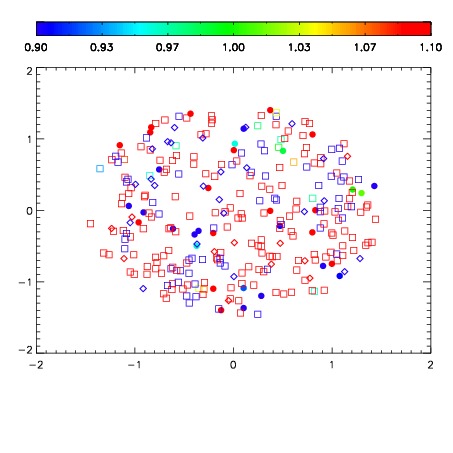
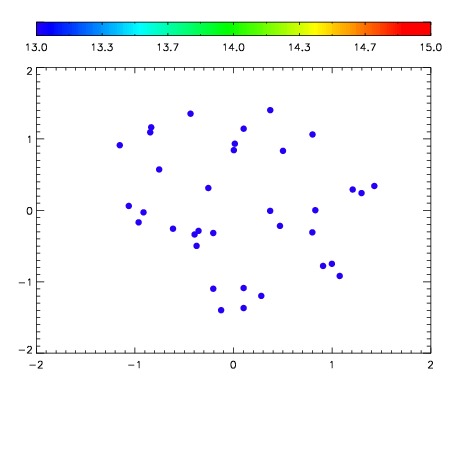

| Frame | Nreads | Zeropoints | Mag plots | Spatial mag deviation | Spatial sky 16325A emission deviations (filled: sky, open: star) | Spatial sky continuum emission | Spatial sky telluric CO2 absorption deviations (filled: H < 10) | |||||||||||||||||||||||
| 0 | 0 |
|
|
|
|
|
|
| IPAIR | NAME | SHIFT | NEWSHIFT | S/N | NAME | SHIFT | NEWSHIFT | S/N |
| 0 | 04870042 | 0.500996 | 0.00000 | 242.388 | 04870040 | -0.00114023 | 0.502136 | 240.877 |
| 1 | 04870043 | 0.500043 | 0.000953019 | 245.672 | 04870044 | -0.00283681 | 0.503833 | 244.760 |
| 2 | 04870039 | 0.496339 | 0.00465700 | 240.887 | 04870041 | -0.00247965 | 0.503476 | 237.689 |
| 3 | 04870038 | 0.496207 | 0.00478899 | 236.924 | 04870037 | 0.00000 | 0.500996 | 229.738 |