| Red | Green | Blue | |
| z | 17.64 | ||
| znorm | Inf | ||
| sky | -Inf | -Inf | -Inf |
| S/N | 29.3 | 49.6 | 54.1 |
| S/N(c) | 0.0 | 0.0 | 0.0 |
| SN(E/C) |
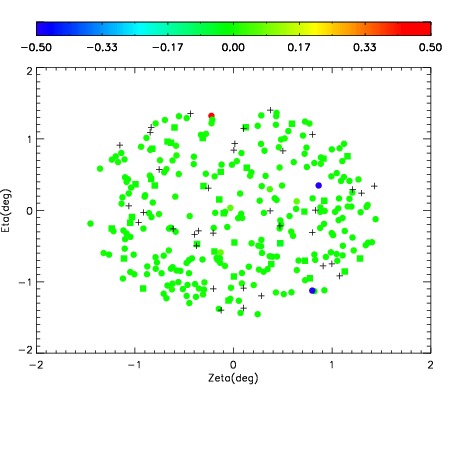
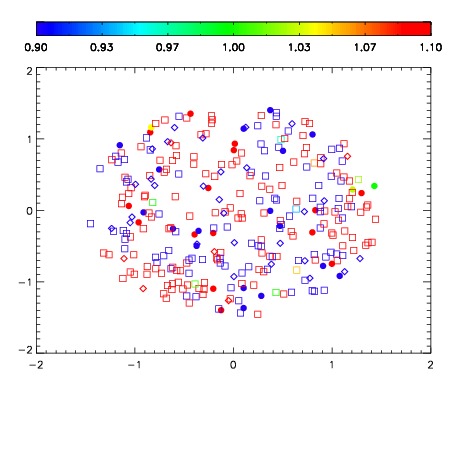


| Frame | Nreads | Zeropoints | Mag plots | Spatial mag deviation | Spatial sky 16325A emission deviations (filled: sky, open: star) | Spatial sky continuum emission | Spatial sky telluric CO2 absorption deviations (filled: H < 10) | |||||||||||||||||||||||
| 0 | 0 |
|
|
|
|
|
|
| IPAIR | NAME | SHIFT | NEWSHIFT | S/N | NAME | SHIFT | NEWSHIFT | S/N |
| 0 | 04920038 | 0.487826 | 0.00000 | 241.780 | 04920035 | 0.00164360 | 0.486182 | 243.709 |
| 1 | 04920037 | 0.486993 | 0.000832975 | 243.967 | 04920036 | -0.00373166 | 0.491558 | 244.340 |
| 2 | 04920034 | 0.487759 | 6.69956e-05 | 241.657 | 04920039 | -0.00313577 | 0.490962 | 243.218 |
| 3 | 04920033 | 0.487371 | 0.000454992 | 238.400 | 04920032 | 0.00000 | 0.487826 | 238.550 |