| Red | Green | Blue | |
| z | 17.64 | ||
| znorm | Inf | ||
| sky | -Inf | -Inf | -Inf |
| S/N | 15.4 | 27.3 | 30.2 |
| S/N(c) | 0.0 | 0.0 | 0.0 |
| SN(E/C) |

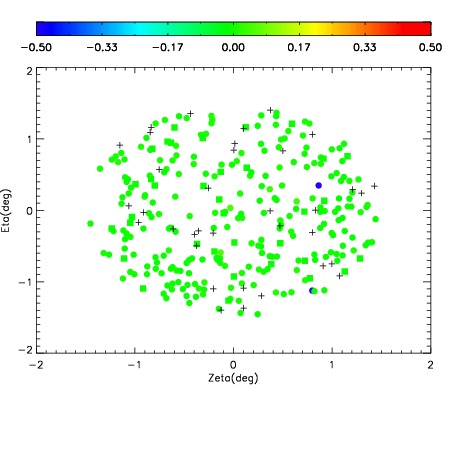
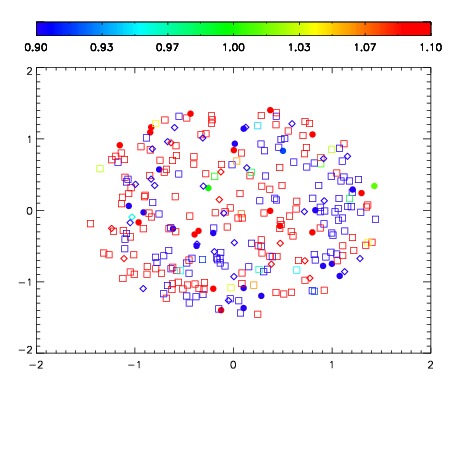
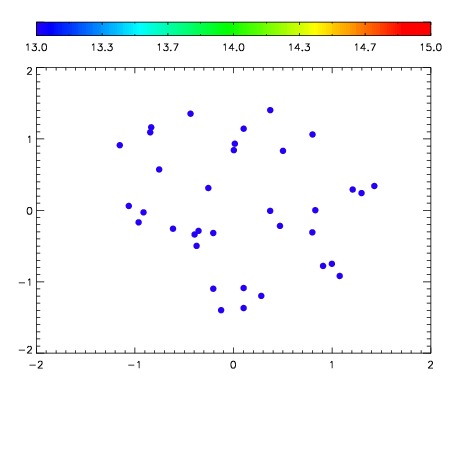

| Frame | Nreads | Zeropoints | Mag plots | Spatial mag deviation | Spatial sky 16325A emission deviations (filled: sky, open: star) | Spatial sky continuum emission | Spatial sky telluric CO2 absorption deviations (filled: H < 10) | |||||||||||||||||||||||
| 0 | 0 |
|
|
|
|
|
|
| IPAIR | NAME | SHIFT | NEWSHIFT | S/N | NAME | SHIFT | NEWSHIFT | S/N |
| 0 | 05210012 | 0.494175 | 0.00000 | 85.9529 | 05210011 | 0.00000 | 0.494175 | 64.6780 |
| 1 | 05210017 | 0.494102 | 7.29859e-05 | 228.516 | 05210018 | -1.36614e-05 | 0.494189 | 237.286 |
| 2 | 05210016 | 0.493575 | 0.000599980 | 193.395 | 05210015 | -0.00249571 | 0.496671 | 158.603 |
| 3 | 05210013 | 0.493955 | 0.000220001 | 112.072 | 05210014 | -0.00126226 | 0.495437 | 138.741 |