| Red | Green | Blue | |
| z | 17.64 | ||
| znorm | Inf | ||
| sky | -NaN | -NaN | -Inf |
| S/N | 25.4 | 41.8 | 50.2 |
| S/N(c) | 0.0 | 0.0 | 0.0 |
| SN(E/C) |
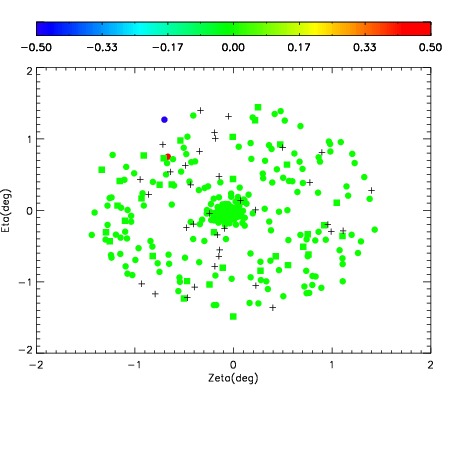
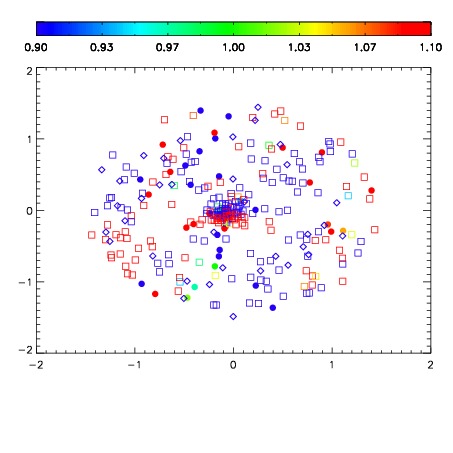
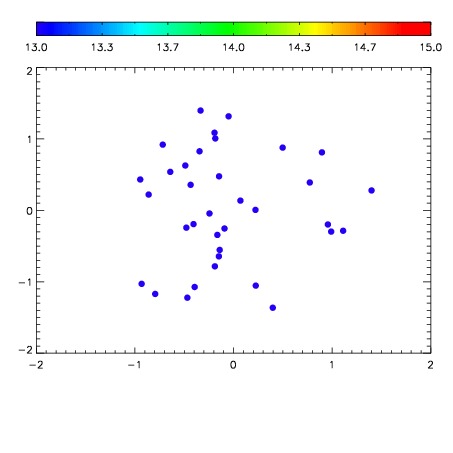

| Frame | Nreads | Zeropoints | Mag plots | Spatial mag deviation | Spatial sky 16325A emission deviations (filled: sky, open: star) | Spatial sky continuum emission | Spatial sky telluric CO2 absorption deviations (filled: H < 10) | |||||||||||||||||||||||
| 0 | 0 |
|
|
|
|
|
|
| IPAIR | NAME | SHIFT | NEWSHIFT | S/N | NAME | SHIFT | NEWSHIFT | S/N |
| 0 | 04020037 | 0.501692 | 0.00000 | 200.545 | 04020038 | 0.00141807 | 0.500274 | 212.463 |
| 1 | 04020036 | 0.500303 | 0.00138903 | 199.400 | 04020039 | -0.000859484 | 0.502551 | 196.724 |
| 2 | 04020041 | 0.501169 | 0.000522971 | 196.725 | 04020035 | 0.00000 | 0.501692 | 191.803 |
| 3 | 04020040 | 0.500274 | 0.00141799 | 185.320 | 04020042 | 0.00153212 | 0.500160 | 188.344 |