| Red | Green | Blue | |
| z | 17.64 | ||
| znorm | Inf | ||
| sky | -Inf | -Inf | -Inf |
| S/N | 36.7 | 63.1 | 78.1 |
| S/N(c) | 0.0 | 0.0 | 0.0 |
| SN(E/C) |
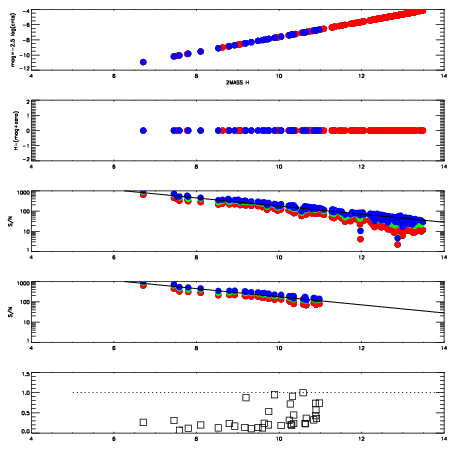
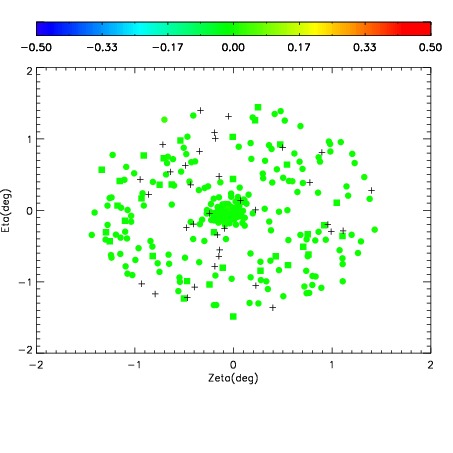
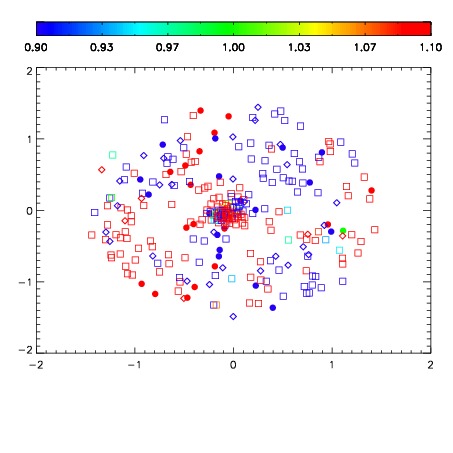
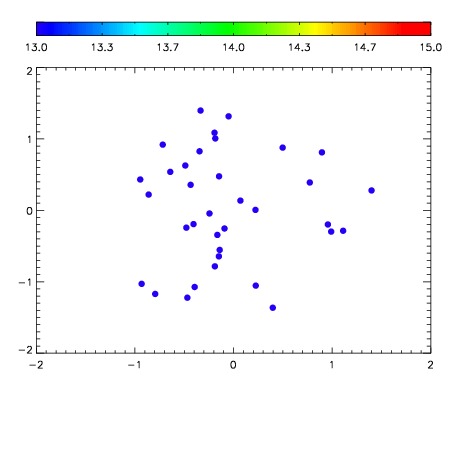

| Frame | Nreads | Zeropoints | Mag plots | Spatial mag deviation | Spatial sky 16325A emission deviations (filled: sky, open: star) | Spatial sky continuum emission | Spatial sky telluric CO2 absorption deviations (filled: H < 10) | |||||||||||||||||||||||
| 0 | 0 |
|
|
|
|
|
|
| IPAIR | NAME | SHIFT | NEWSHIFT | S/N | NAME | SHIFT | NEWSHIFT | S/N |
| 0 | 04290080 | 0.508700 | 0.00000 | 168.748 | 04290089 | 0.00312000 | 0.505580 | 171.254 |
| 1 | 04290084 | 0.506407 | 0.00229299 | 176.080 | 04290078 | 0.00000 | 0.508700 | 179.648 |
| 2 | 04290079 | 0.498510 | 0.0101900 | 171.448 | 04290082 | 0.00373393 | 0.504966 | 176.278 |
| 3 | 04290083 | 0.499005 | 0.00969502 | 170.497 | 04290081 | 0.000818775 | 0.507881 | 173.747 |
| 4 | 04290095 | 0.503278 | 0.00542200 | 169.762 | 04290085 | 0.00150127 | 0.507199 | 173.353 |
| 5 | 04290092 | 0.503680 | 0.00502002 | 166.663 | 04290090 | 0.00182907 | 0.506871 | 171.043 |
| 6 | 04290091 | 0.502669 | 0.00603104 | 166.090 | 04290093 | 0.00240661 | 0.506293 | 169.258 |
| 7 | 04290087 | 0.499352 | 0.00934801 | 165.187 | 04290086 | 0.00175012 | 0.506950 | 168.802 |
| 8 | 04290088 | 0.500024 | 0.00867599 | 162.362 | 04290094 | 0.00288343 | 0.505817 | 168.186 |