| Red | Green | Blue | |
| z | 17.64 | ||
| znorm | Inf | ||
| sky | -Inf | -Inf | -Inf |
| S/N | 22.6 | 39.7 | 51.9 |
| S/N(c) | 0.0 | 0.0 | 0.0 |
| SN(E/C) |

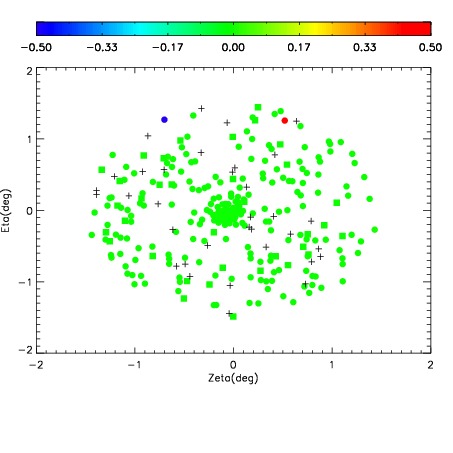

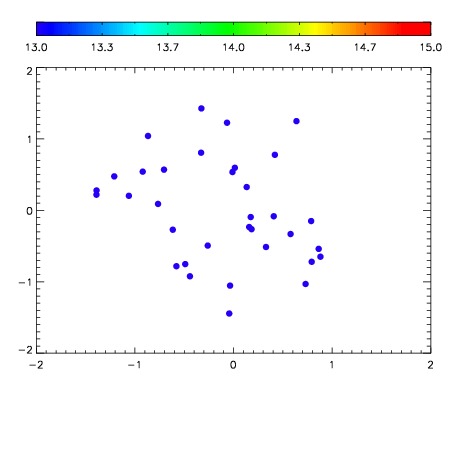

| Frame | Nreads | Zeropoints | Mag plots | Spatial mag deviation | Spatial sky 16325A emission deviations (filled: sky, open: star) | Spatial sky continuum emission | Spatial sky telluric CO2 absorption deviations (filled: H < 10) | |||||||||||||||||||||||
| 0 | 0 |
|
|
|
|
|
|
| IPAIR | NAME | SHIFT | NEWSHIFT | S/N | NAME | SHIFT | NEWSHIFT | S/N |
| 0 | 04360049 | 0.490267 | 0.00000 | 172.297 | 04360047 | 0.00000 | 0.490267 | 173.690 |
| 1 | 04360048 | 0.489219 | 0.00104800 | 174.814 | 04360050 | -0.00284690 | 0.493114 | 175.819 |
| 2 | 04360053 | 0.487494 | 0.00277302 | 165.847 | 04360051 | -0.00356035 | 0.493827 | 167.956 |
| 3 | 04360052 | 0.485859 | 0.00440800 | 161.596 | 04360054 | -0.00291644 | 0.493183 | 131.978 |