| Red | Green | Blue | |
| z | 17.64 | ||
| znorm | Inf | ||
| sky | -Inf | -Inf | -Inf |
| S/N | 18.0 | 32.9 | 34.4 |
| S/N(c) | 0.0 | 0.0 | 0.0 |
| SN(E/C) |
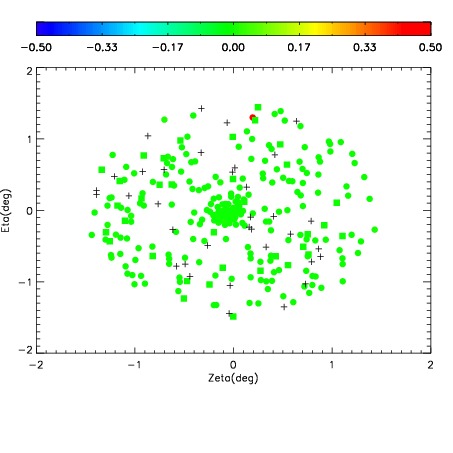
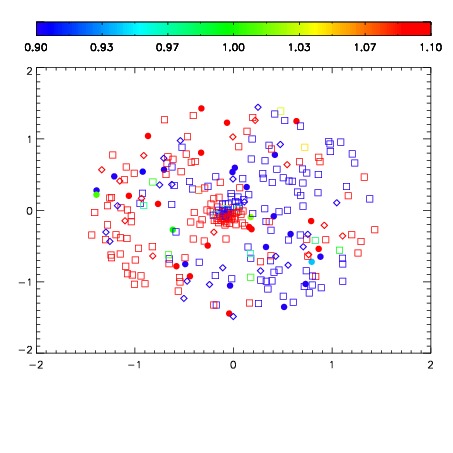
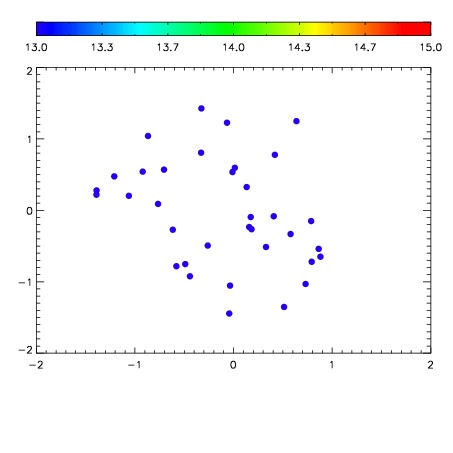

| Frame | Nreads | Zeropoints | Mag plots | Spatial mag deviation | Spatial sky 16325A emission deviations (filled: sky, open: star) | Spatial sky continuum emission | Spatial sky telluric CO2 absorption deviations (filled: H < 10) | |||||||||||||||||||||||
| 0 | 0 |
|
|
|
|
|
|
| IPAIR | NAME | SHIFT | NEWSHIFT | S/N | NAME | SHIFT | NEWSHIFT | S/N |
| 0 | 04630012 | 0.497119 | 0.00000 | 110.419 | 04630010 | 0.00000 | 0.497119 | 115.616 |
| 1 | 04630016 | 0.495028 | 0.00209102 | 162.285 | 04630014 | -0.000918212 | 0.498037 | 153.872 |
| 2 | 04630015 | 0.493796 | 0.00332302 | 156.379 | 04630017 | -0.00105897 | 0.498178 | 152.850 |
| 3 | 04630019 | 0.496149 | 0.000970006 | 140.426 | 04630018 | -0.00112377 | 0.498243 | 143.310 |
| 4 | 04630011 | 0.495844 | 0.00127500 | 128.315 | 04630013 | -0.00174216 | 0.498861 | 129.153 |